For each buy idea, you’ll see:
1-the pattern in blue
2-target
3-the suggested stop in red
For each short idea, you’ll see:
1-the pattern in red
2-target
3-the suggested stop in blue
Buys
Bullish Pattern Breakouts
COST, MGY, TSLA
Buy the dip in an uptrend
Severely oversold & near support
Shorts
Bearish Pattern Breakdowns
Short the rip in a downtrend
Overextended to the upside
Earnings
Overview
With the huge day yesterday, many stocks spiked and closed near their intra-day high points. That has come after a few weeks of consolidation, over which time we saw fewer stocks make new 52-week highs. That changed in a major way yesterday.
And while the market got the “certainty” it was looking for, the ultra-strong move has made some stocks now suddenly appear short-term extended. Thus, there will be ebbs and flows from here, but we’ll continue to highlight potential breakouts as they appear regardless. Here are three new trade ideas to consider.
Bullish Pattern Breakouts
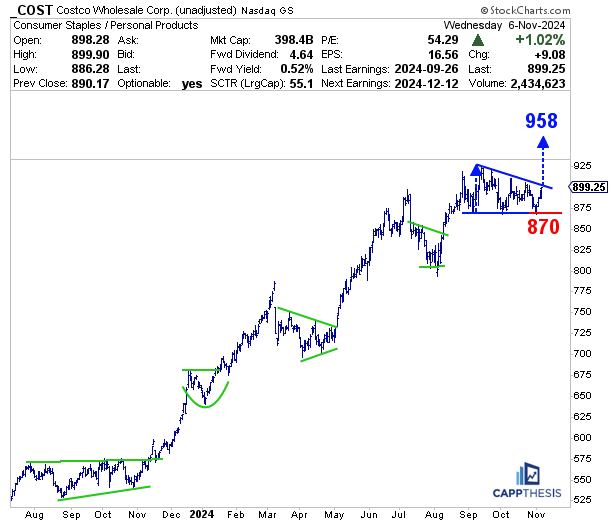
COST needs no introduction. It’s been in a perennial uptrend for years and especially since breaking out to new all-time highs back in November’23. Along the way, it has logged various digestive phases, formed bullish patterns, broken out and… and then repeating that process.
While the patterns over the last year all have looked different, COST routinely has seen upside follow through upon breaking out. Right now, COST is close to completing another recognizable symmetrical triangle pattern that has formed since September. A breakout would target 958.
COST next reports earnings on 12/12/24.

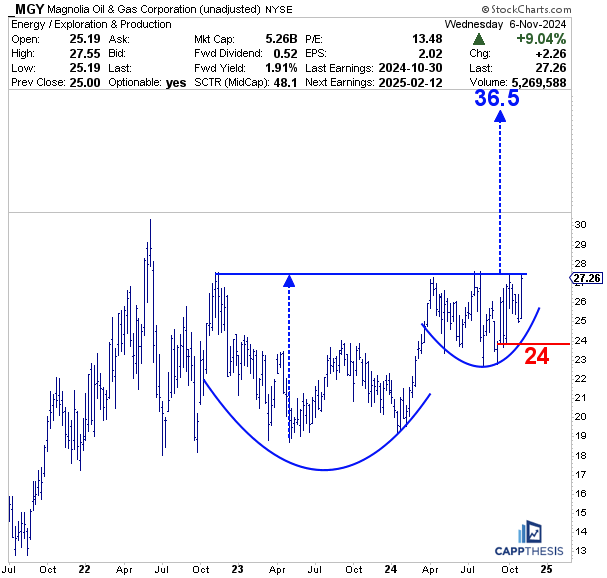
Unlike many Exploration & Production stocks, MGY is close to making new multi-year highs. And if the bid in Crude Oil is real this time, this very well could happen soon. And if it does, MGY will have the chance to leverage this large, two-year potential cup and handle pattern. A breakout would yield an upside objective up to 36.5.
MGY next reports earnings on 2/2/25.

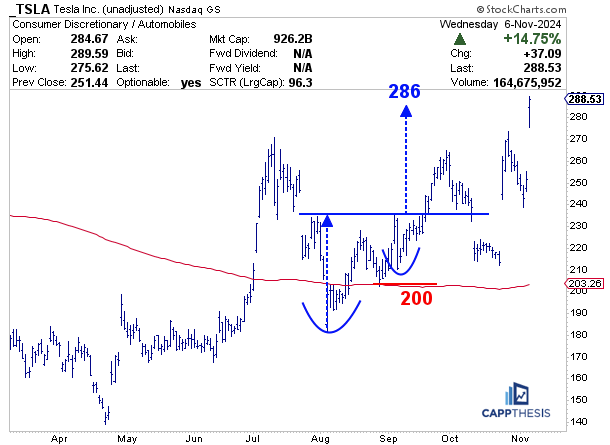
We last recommended TSLA on the morning of 9/13. It broke out a few days later and quickly followed through until the end of September. The gap down on 10/11 pulled TSLA below that breakout zone, but the stock was able to hold before revisiting its 200-DMA. And as is typical for TSLA, two massive upside gaps have taken place since, which has brought the stock all the way back near 290 through yesterday. Needless to say, because of this, TSLA’s daily chart is messy…

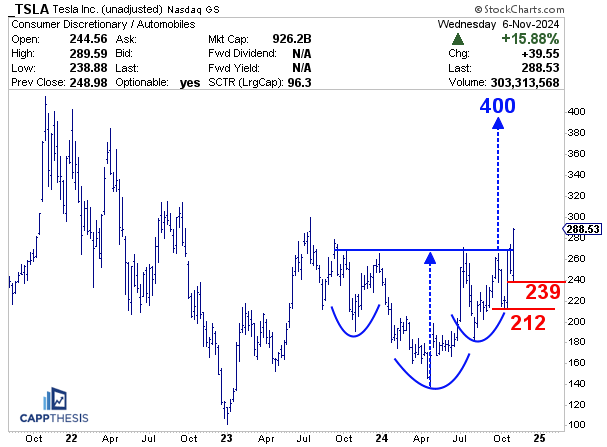
…but all of that has prompted a much cleaner-looking inverse head & shoulders pattern on the weekly chart, which is what we’re focusing on today. Yes, the stock is EXTREMELY volatile, but a hold near the 270 level on prospective weakness would keep the 400-price target in play. Depending on one’s personal risk tolerance, below are two suggested stop loss levels.
TSLA next reports earnings on 1/22/25.


