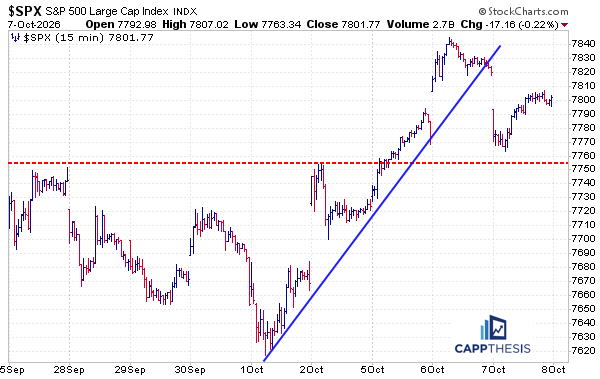
Daily Price Action
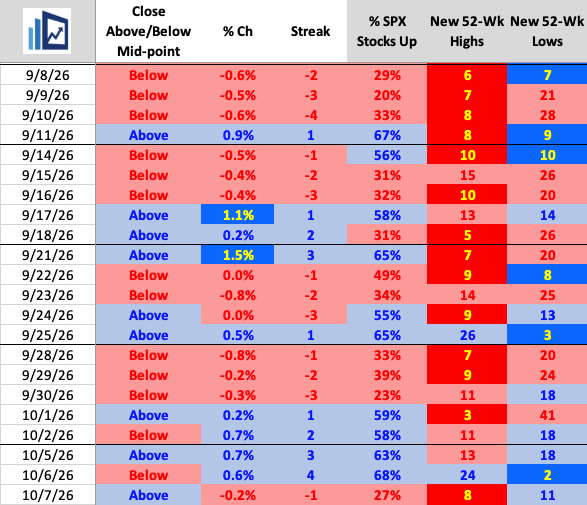
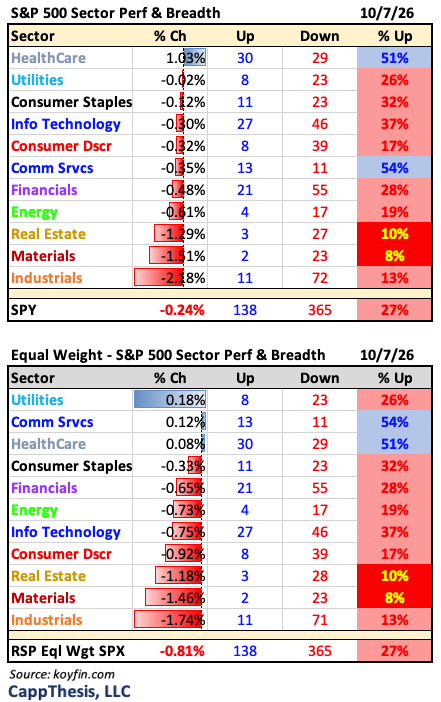
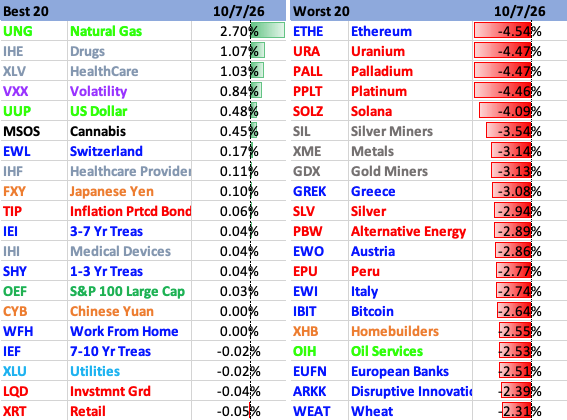
The 27% advancing stocks yesterday was among the lowest readings of the past month. While we would have liked to see the streak of positive internals continue beyond four, the key now is to avoid another prolonged period deterioration in participation, especially after the solid rebound in breadth we saw as October began.

XLI Industrials
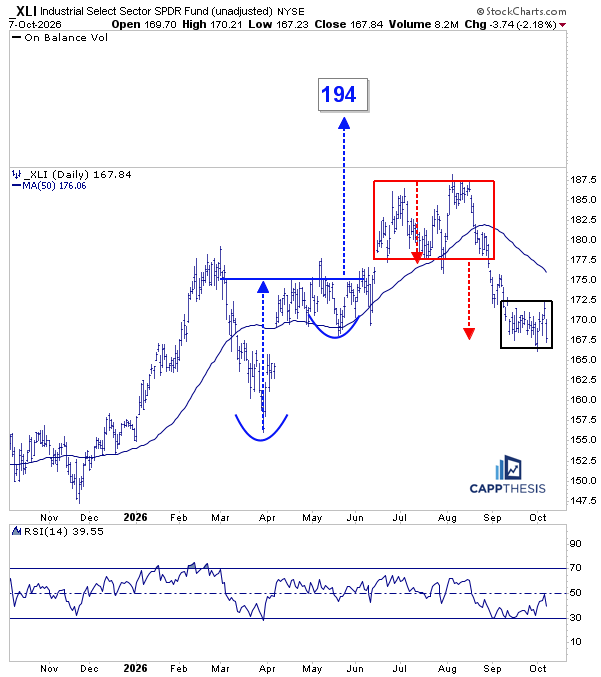
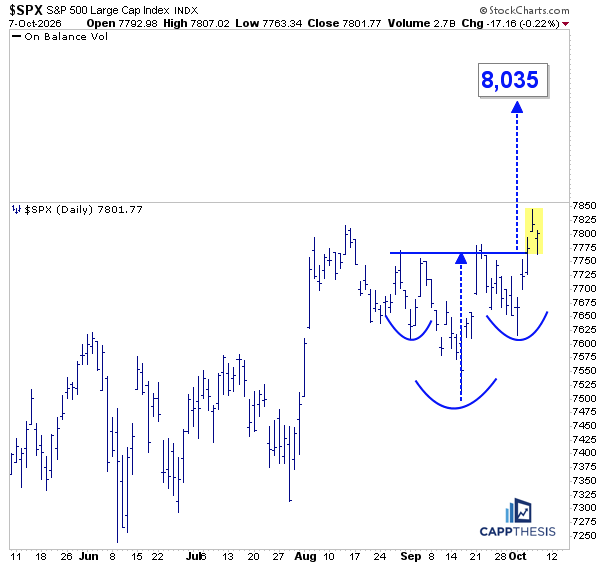
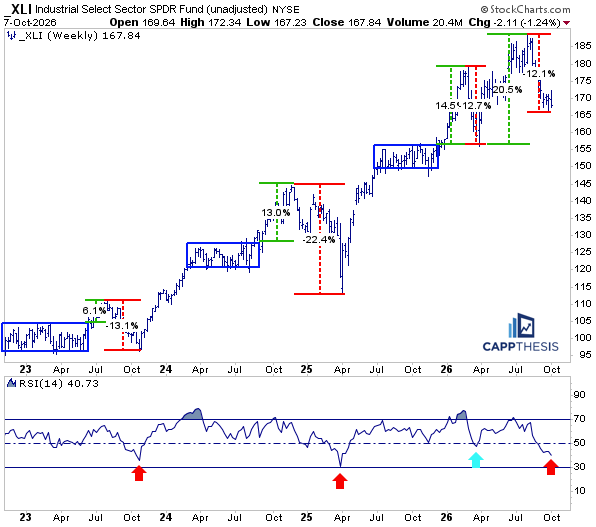
XLI’s current pullback is now approximately 12%, and as this chart shows, substantial declines following strong rallies have been the norm since 2023. We’ve seen several impressive advances, many stemming from upside trading box breakouts, but most have eventually given way to sizable pullbacks.
The key now is whether XLI can maintain its longer-term series of higher lows, which has remained intact throughout this period except for the tariff tantrum decline in early 2025.
XLI vs. XLK
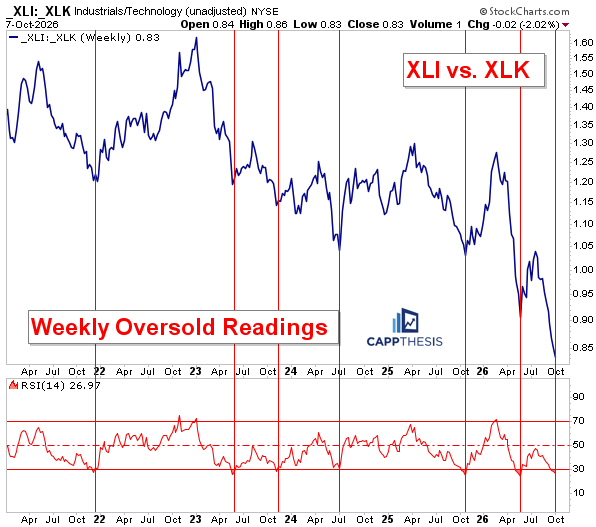
One relative ratio we’re watching is XLI vs. XLK, which has declined considerably over the past few weeks as XLI has rolled over and XLK has broken out. Although the longer-term, five-year trend in this ratio has been lower, there have been periods when XLI has outperformed XLK, typically following oversold conditions on the weekly chart, which have just been reached again.
The last such reading occurred at the beginning of the summer, as Technology was rolling over and other areas of the market began showing relative strength, accompanied by improving breadth. It has another chance now.
XLF Financials
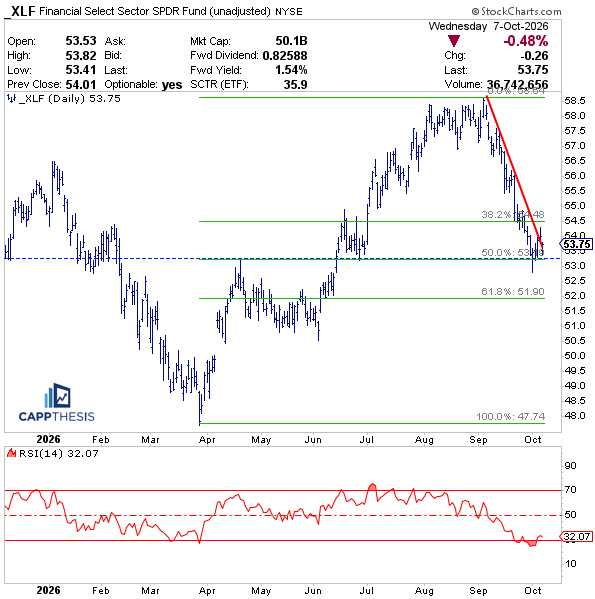
We discussed a few days ago how XLF was approaching a confluence of support, which it continues to try to respect. The 50% retracement of the entire rally coincides with support from June, making this an important area to hold.
If XLF cannot take advantage of these depressed conditions and, at the very least, break above its downtrend line, it would suggest that investors remain unconvinced. This uncertainty could persist into next week, when the largest financial companies begin reporting earnings.
XLF vs. SPX
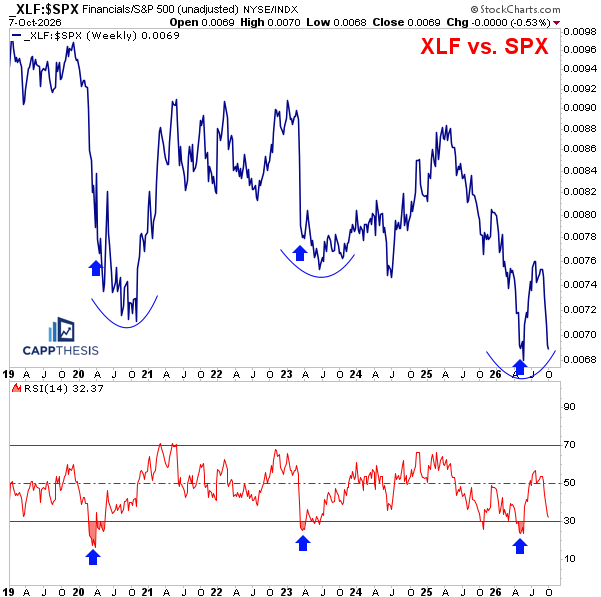
We identified the potential for XLF to outperform the SPX over the summer as the relative ratio became extremely oversold on a weekly basis. That played out, but the subsequent rally has since been completely reversed. With the ratio now approaching oversold territory once again, its ability to stabilize and potentially rebound will be telling.
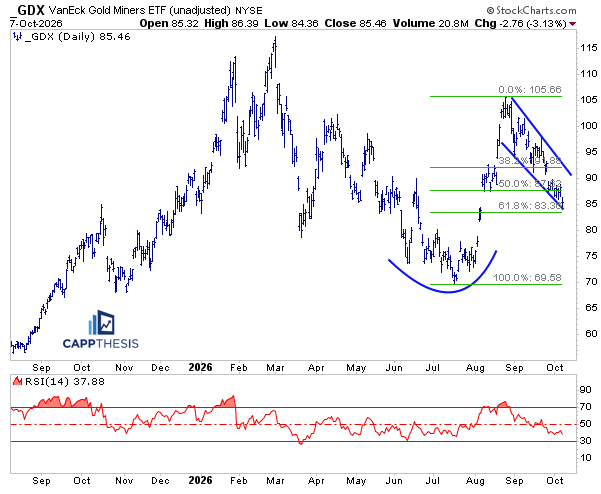
GDX Gold Miners
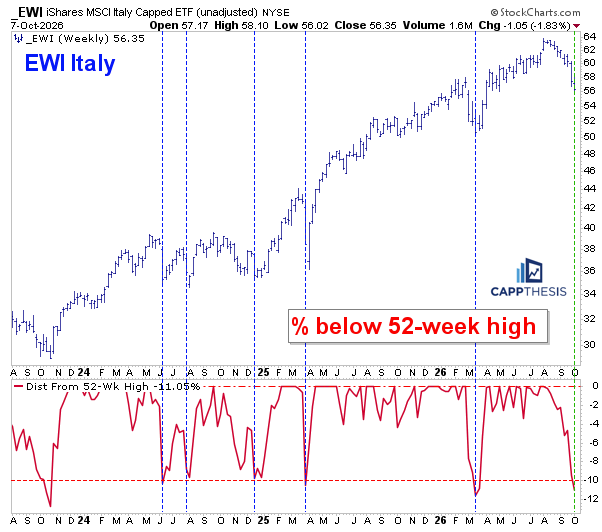
EWI Italy
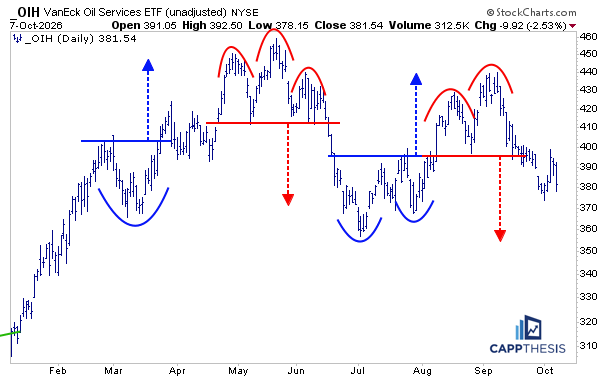
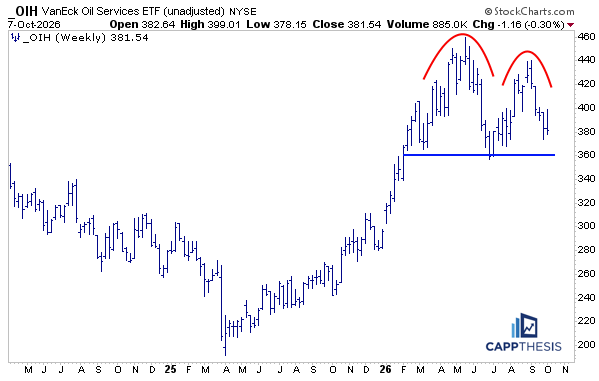
OIH Oil Services
TAN Solar
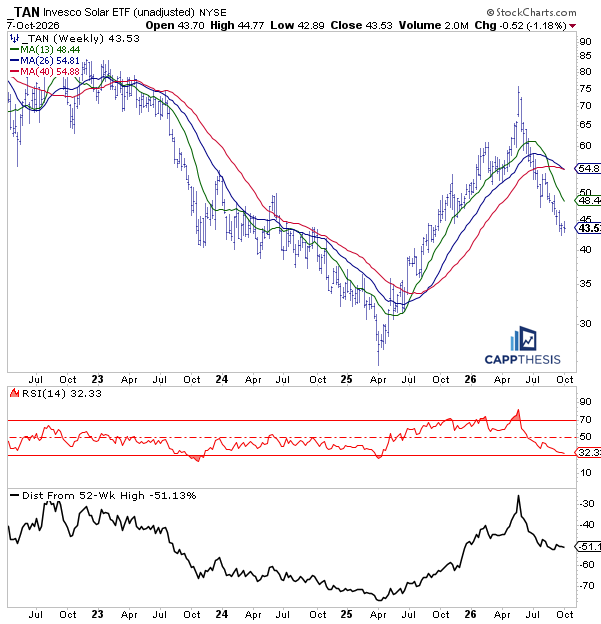
TAN’s current downtrend has been persistently steep, while its weekly RSI is also approaching oversold territory. As the bottom panel shows, the ETF has declined nearly 50% from its most recent 52-week high. While substantial, that drawdown remains well short of the extremes reached during the preceding multi-year decline.
For now, we’d rather see evidence of a sustained rally attempt rather than trying to catch a falling knife. That approach hasn’t worked over the past several months, nor did it during the multi-year downtrend that preceded the 2025 recovery.
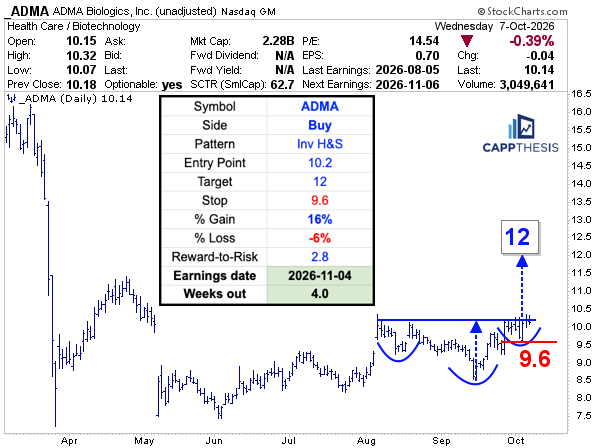
ADMA (ADMA Biologics, Inc.)
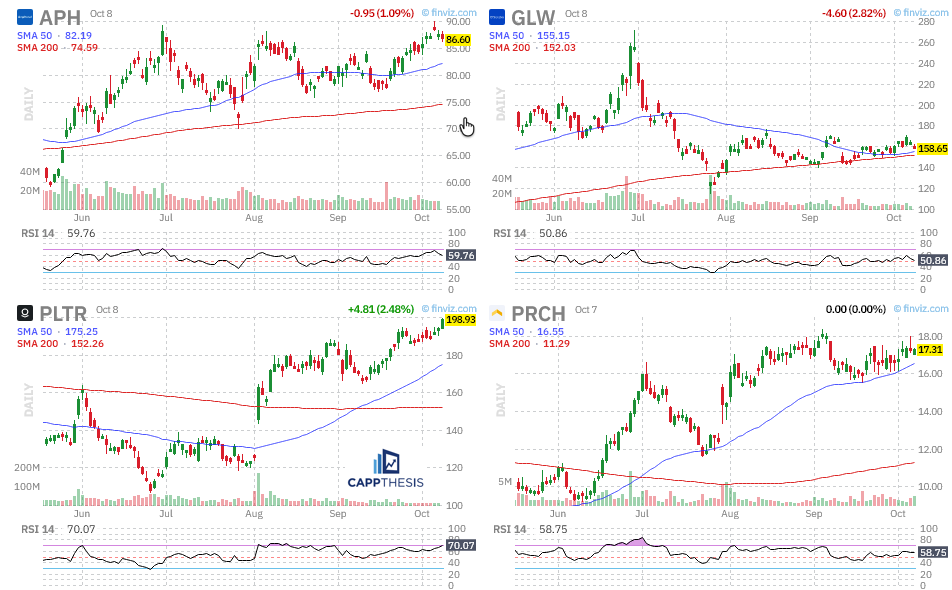
Watch list: APH, GLW, PLTR, PRCH