


Chart Rundown – 9/4/26

Chart Rundown – 9/4/26

Chart Rundown – 9/4/26


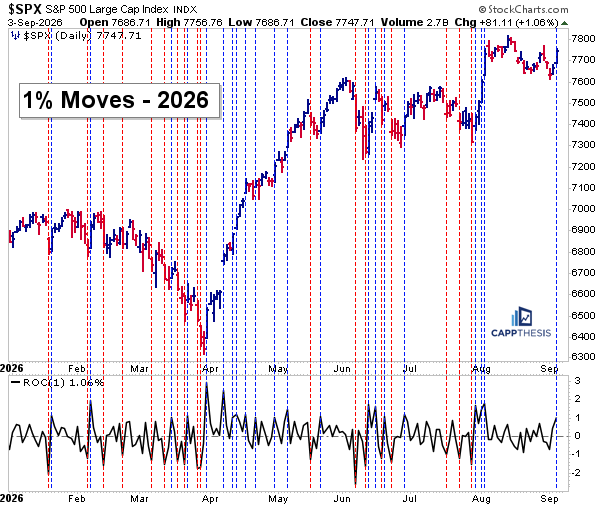
A 1% Gain
Yesterday marked the SPX’s first 1% gain since August 4, snapping a 21-day streak without one. Its last 1% decline came on July 29—FOMC Day.

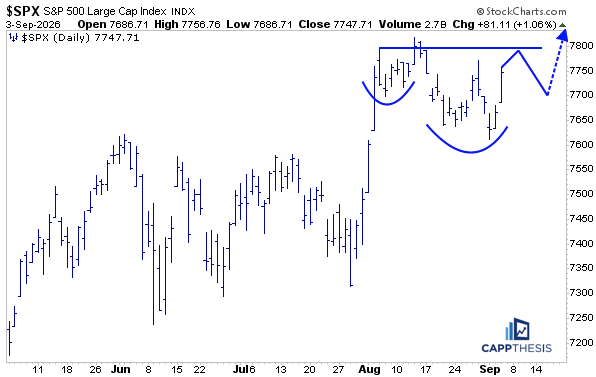
This kept the potential bullish pattern in play.

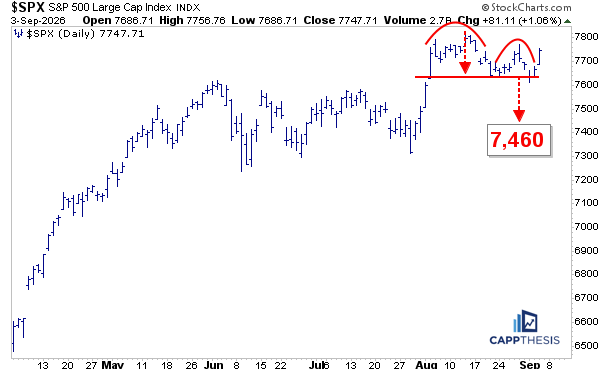
While putting the bearish formation on the brink of being negated.


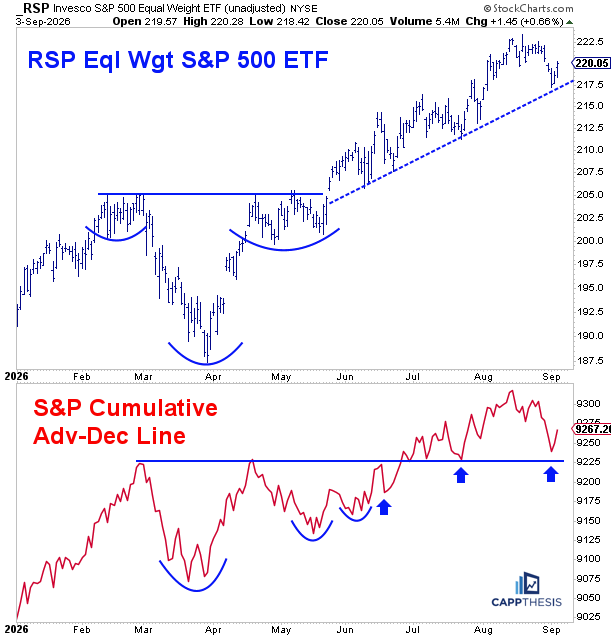
RSP & Breadth
RSP continues to ride its uptrend line following its May breakout
, while the SPX’s advance-decline line held near its own breakout area amid yesterday’s strong breadth, with 68% advancing stocks.


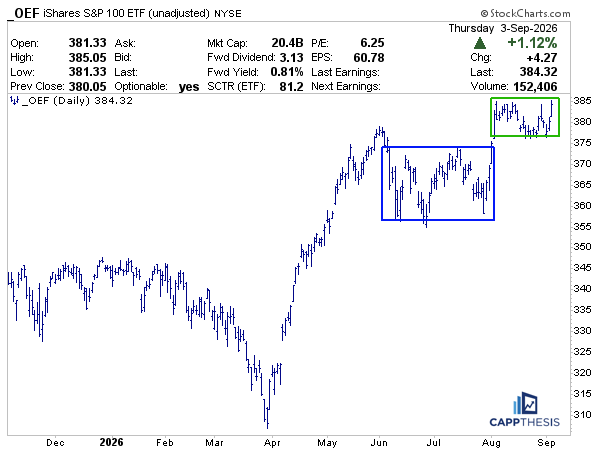
OEF – SPX 100 ETF
OEF  is nearing its second trading-box breakout of the summer.


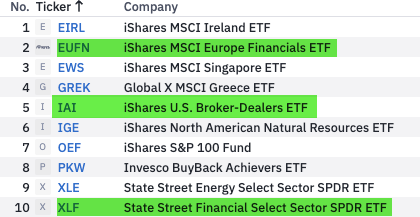
Key ETFs – New ALL-TIME Highs
Ten key ETFs we follow made new all-time highs yesterday, including three Financials ETFs.


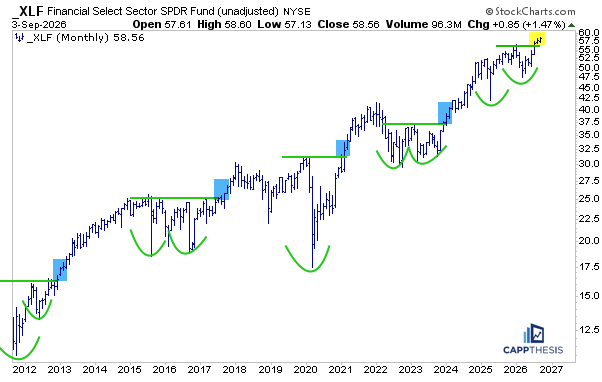
XLF Financials
XLF continues to break out from its year-plus bullish formation, while prior multi-year breakouts led to substantial upside follow-through.


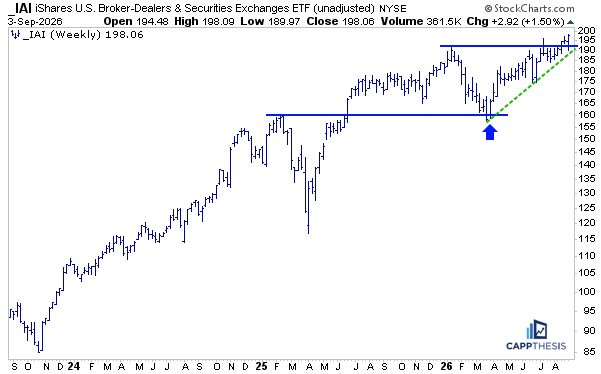
IAI Broker Dealers

IAI also made a new all-time high yesterday as it attempts to extend from its 10-month bullish pattern.


EUFN European Financials
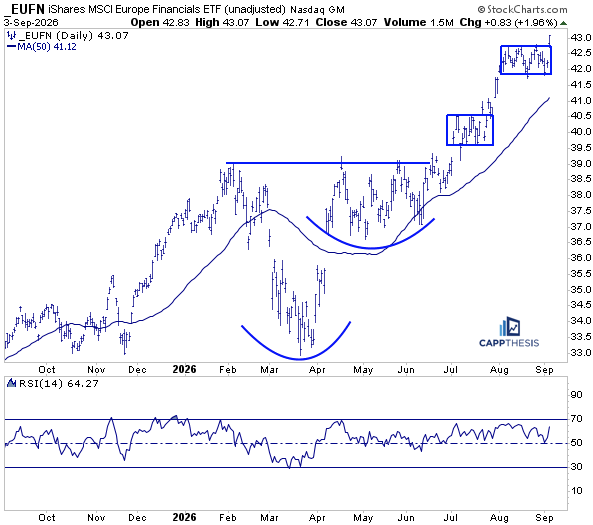
EUFN emphatically broke out of its second trading box in the last few months.


XLK Tech
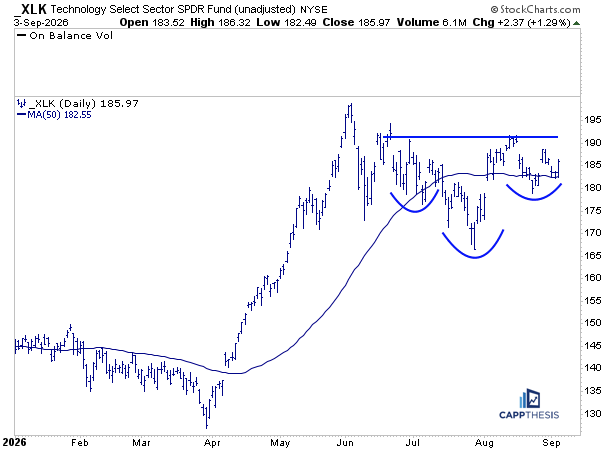
XLK bounced 1.3% on Thursday near its 50-day moving average. But it still has work to do before breaking out from this potential three-month inverse head-and-shoulders pattern.


SMH Semis
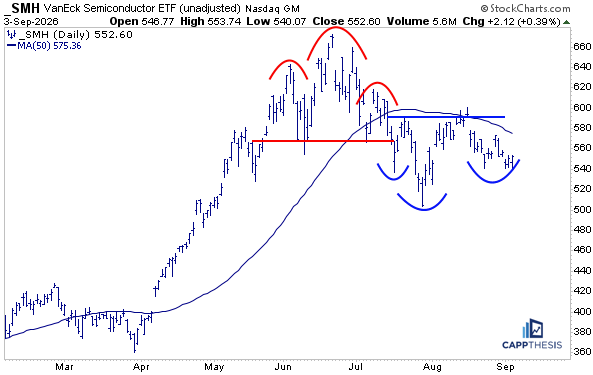
SMH continues to struggle, leaving both the bullish and bearish patterns in play.


MAGS 7 ETF
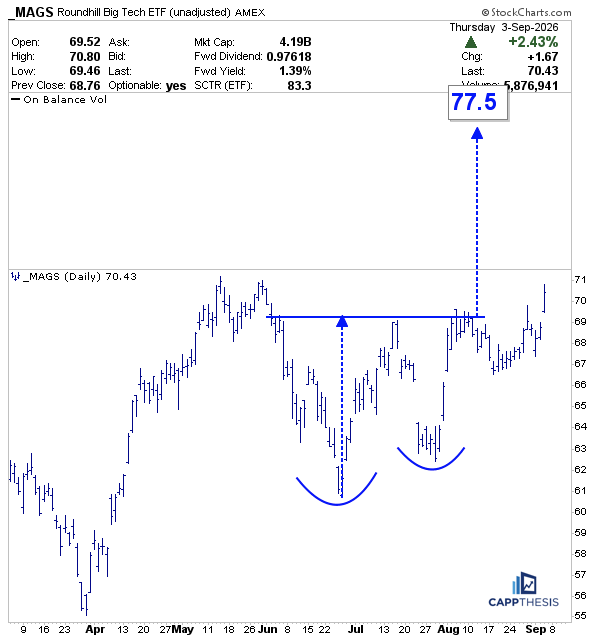
MAGS had a strong day Thursday and finally broke out from its bullish pattern. If the breakout holds, the upside target is near 77.50.


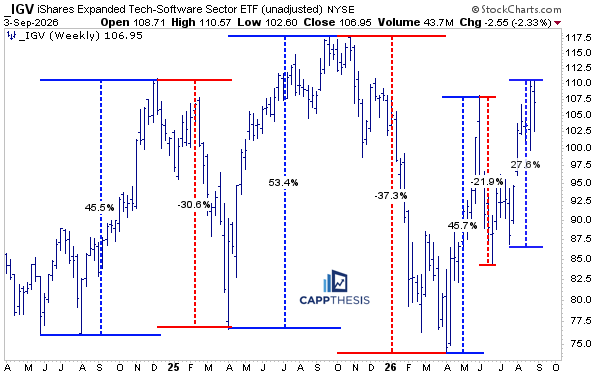
IGV Software
IGV also snapped back, giving it a chance to extend its recent 28% trough-to-peak advance.


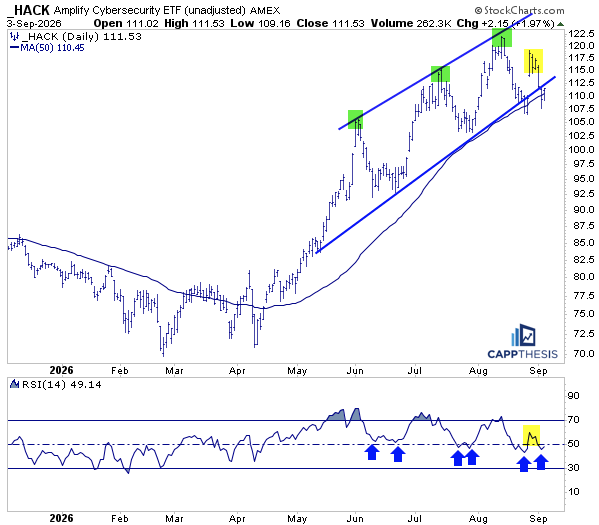
HACK Cybersecurity
HACK again saw demand surface near the lower boundary of its trading channel and 50-day moving average. The last bounce failed to reach the channel’s upper boundary, which we’ll be watching closely on this latest rally attempt.


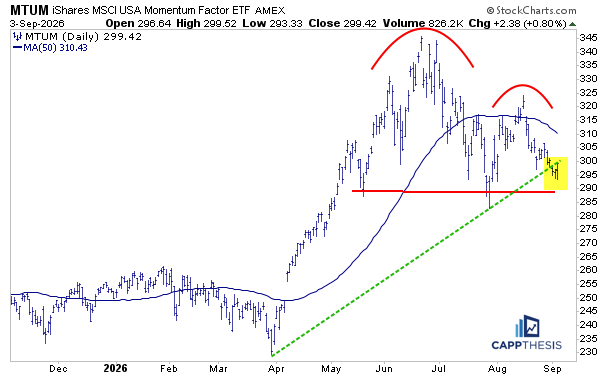
MTUM Momentum
MTUM continues to lag, mainly because its largest group by far is Semiconductors (25%), followed by Hardware (10%). Thus, leveraging yesterday’s bounce near two key support lines is important.


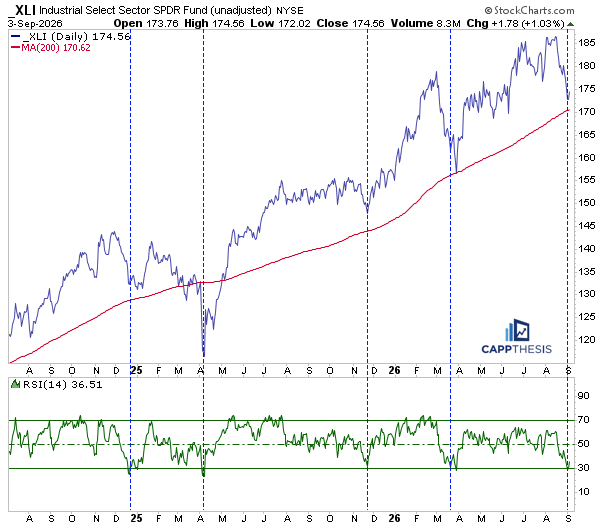
XLI Industrials
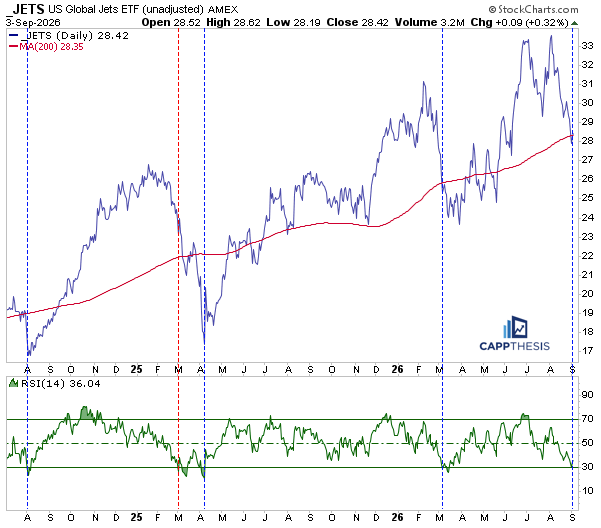
XLI bounced back 1% yesterday. Over the last two years, tradable lows often have developed near the 200-day moving average and/or oversold conditions, both of which are in play again. The next step is following through.


JETS ETF
Ditto for JETS.


IHF HC Providers
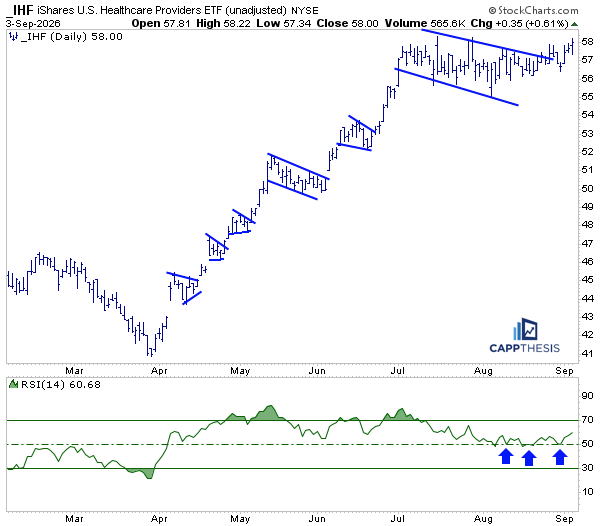
IHF finally has pushed above its long trading channel over the last few days after RSI held near 50 since early August. It’s now close to overtaking its summer highs, as well, which could produce a significant breakout.


XLE Energy
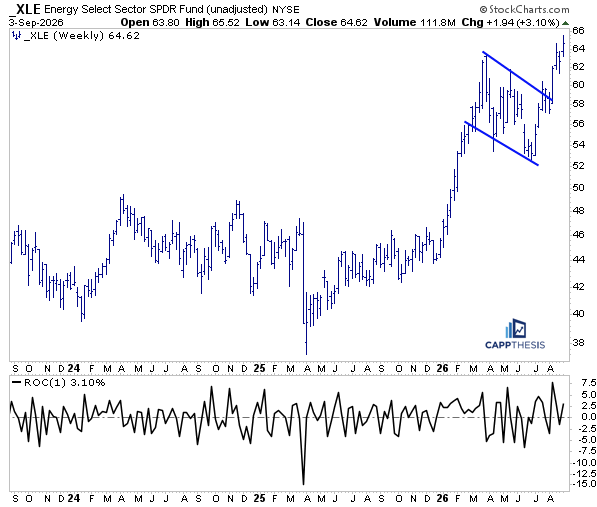
XLE continues to extend from its major pattern breakout on the weekly chart.


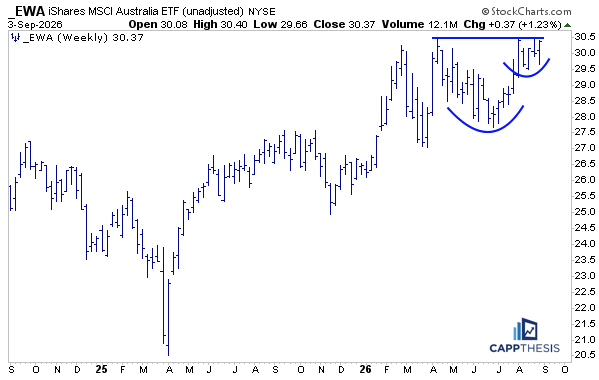
EWK Belgium & EWA Australia
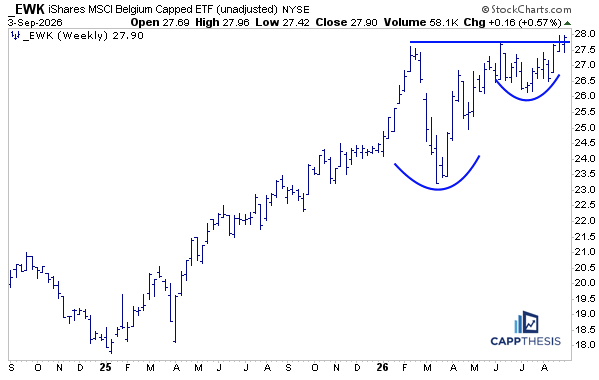
Both foreign ETFs are sporting potentially substantial weekly bullish patterns.


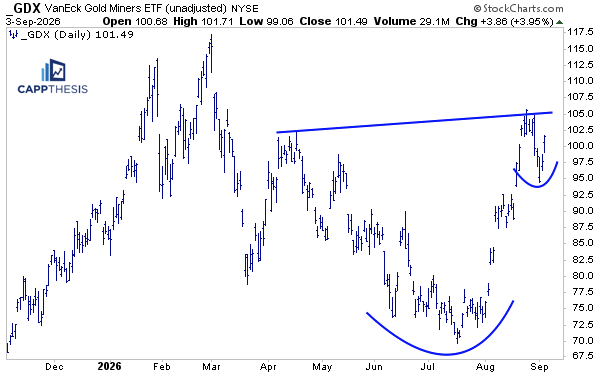
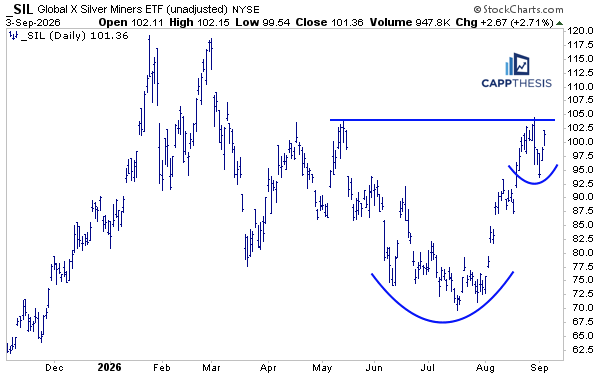
GDX & SIL
Yesterday’s snapbacks in GDX and SIL have created potentially large cup-and-handle patterns.


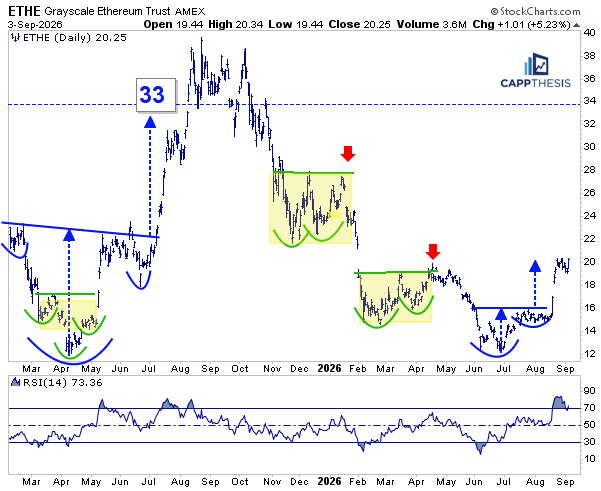
ETHE Ethereum
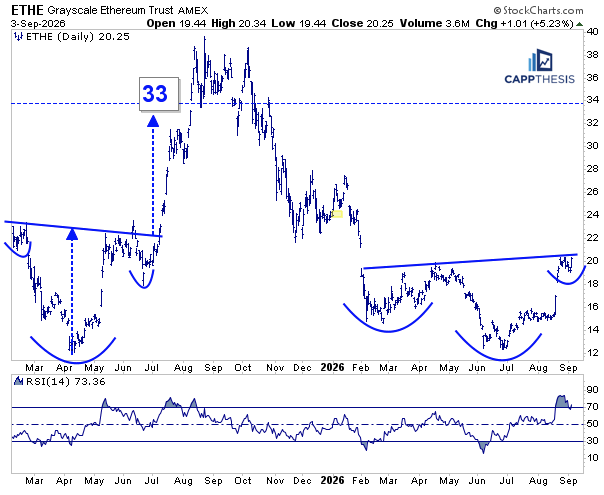
ETHE hit its initial small bullish pattern target in just a few days…

And it now has a chance to leverage a much larger base, similar to the one it broke out from last spring and summer.


BE (Bloom Energy Corp.)
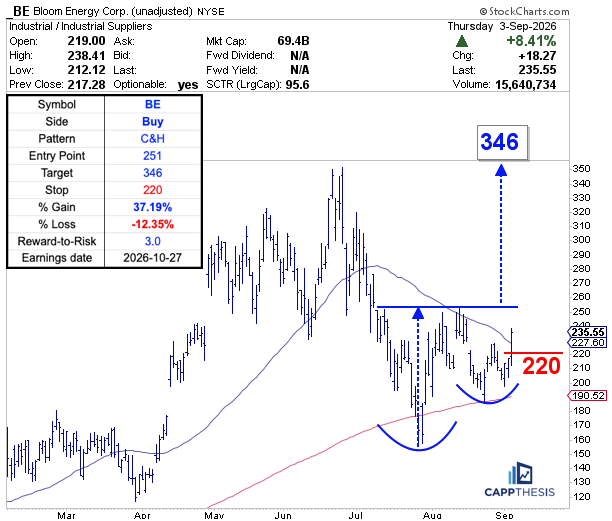
BE has been one of the best-performing stocks in 2026 but also endured a 50%+ decline from its mid-June high. Since bottoming in late July, BE has bounced back, recently holding its 200-day moving average as support while attempting to reclaim its declining 50-day moving average.

The stock also is close to completing a significant cup-and-handle pattern. Given BE’s elevated volatility (it gained 8% yesterday), the setup remains aggressive, but the stock has proven capable of leveraging breakouts this year.

A move above the August highs near 251 would trigger the pattern and produce a 346-upside target, near the June highs. We’re using 220 as the initial stop-loss, roughly 12% below the proposed entry.

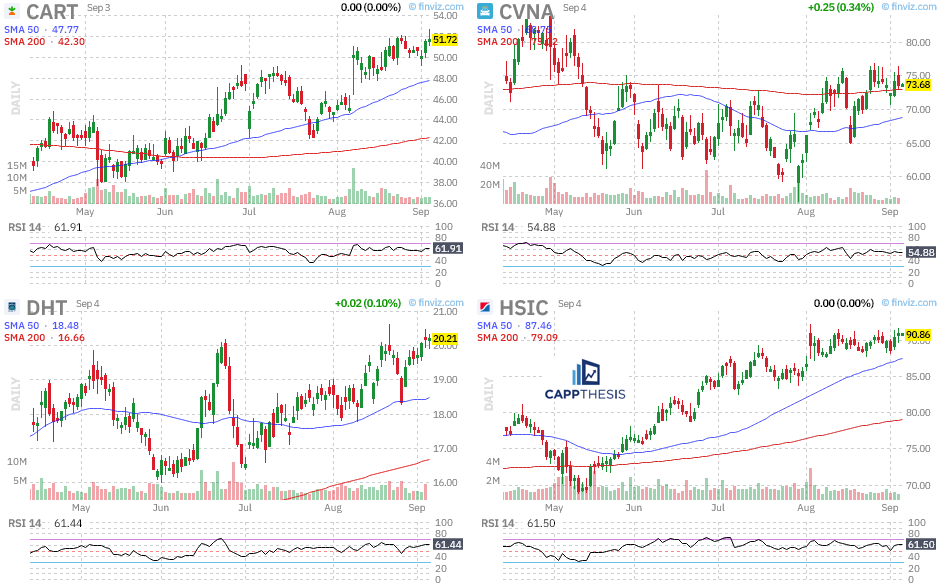
Watch list:  CART, CVNA, DHT, HSIC

MORE LIKE THIS