Key Points:
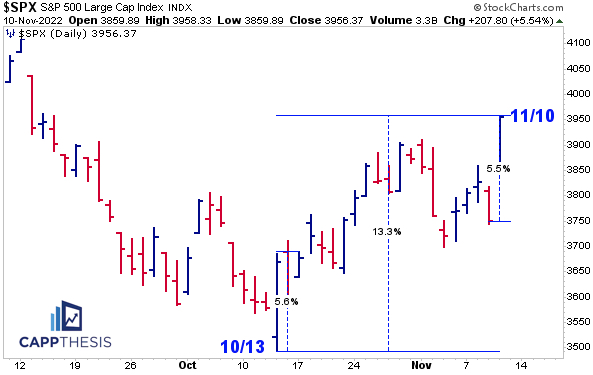
1- Combined, the SPX’s total moves of 10/13 and 11/10 = +11.1% or 83% of the total +13.3% peak-to-trough rally.
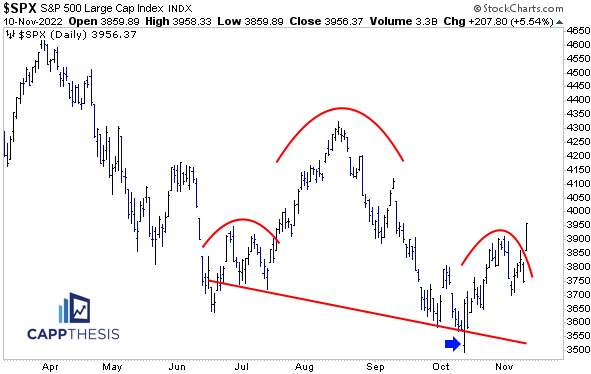
2- The SPX’s recent hold near 3,700 produced a key higher low, which morphed into the cup & handle pattern that the index completed yesterday.
3-Bullish formations have been short-lived in 2022, and now the SPX has another chance at leveraging one. A continued hold above the 3,900 zone would target roughly 4,310, which lines up with the August highs.
Topics Reviewed
SPX: CPI, % moves, new upside target, next resistance points, potential blueprint
US Dollar, 10 Year Yield, HYG High Yield Bonds
SPX
The market suddenly LOVES CPI Day. The SPX now has been higher three of the last four dates the report was released. The actual number was BELOW estimates in August and November and ABOVE estimates in October. All three gains were at least +2%.
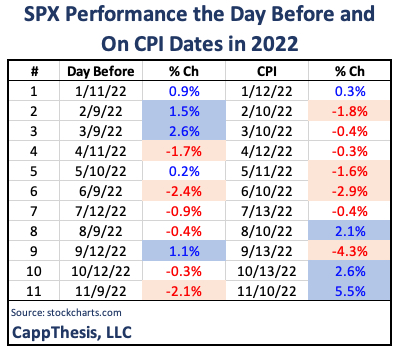
The last two reactions, of course, were historic.
The +5.6% positive reversal on 10/13 was among the SPX’s biggest EVER intra-day comebacks.
And yesterday’s +5.5% official advance was only the 26th 5% advance in the last 50 years.
Overall, Thursday’s pop extended the trough to peak move to +13.3%, which is the second biggest multi-week rally of 2022.
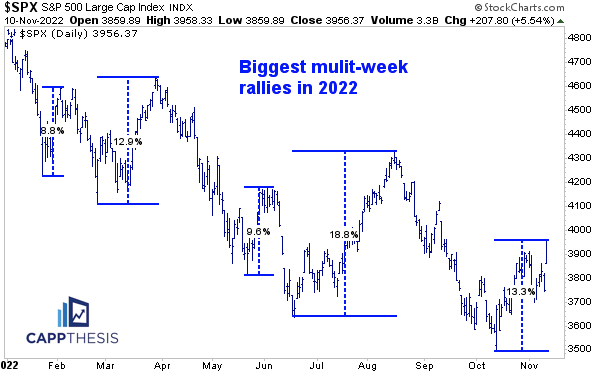
Again, we can thank the CPI reactions for nearly all of that. Combined, the intra-day moves of both 10/13 and 11/10 = +11.1% or 83% of the +13.3% total rally.
Even more telling, there were 19 trading days in between the CPI releases. The SPX logged NINE gains and TEN losses during that time, which included three declines worse than 2%.
So, what is that telling us?
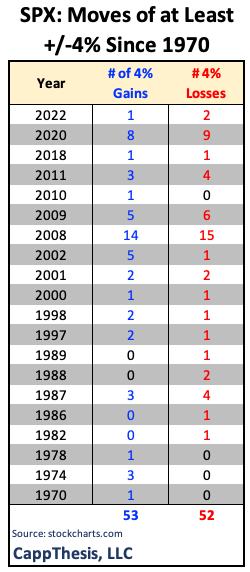
First, we know that the biggest moves (up and down) take place in the most stressed market environments. Here’s that table we cited in Last Licks last night.
But the largest gains can ALSO kickstart a positive momentum swing. Some obvious examples from the last decade are March-April’20, December’18, October’11 and March’09. Those years all appear on the table, not surprisingly.
The other common theme for each of those time periods was that those clusters of big moves built SUCCESSFUL bullish patterns.
We’ve seen the SPX try the same thing recently, but because of the aforementioned volatile back and forth in between the CPI reports, those budding formations never got going when we most needed them.
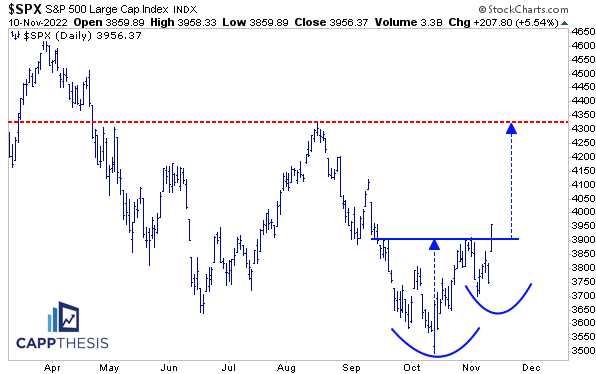
That said, one of the best things that took place in the last few weeks was the index’s ability to hold near 3,700. That produced a potential higher low, which morphed into the handle of the clear cup & handle pattern below.
So, now the index has yet another chance.

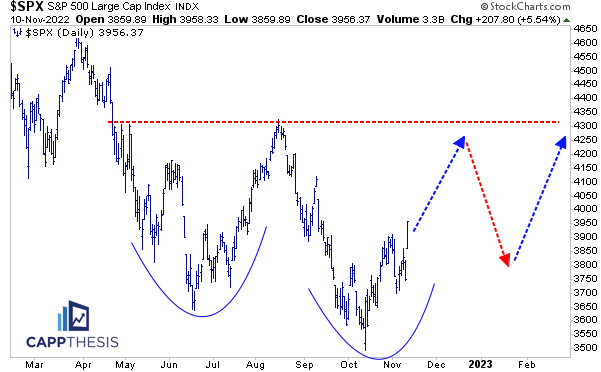
A continued hold above the 3,900 zone would target roughly 4,310, which lines up with the August highs.
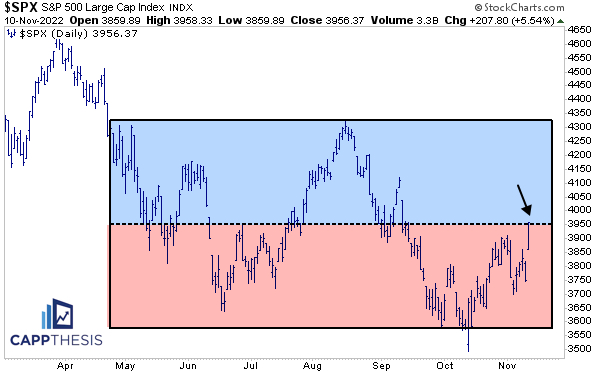
That also is the top of the seven-month trading range we’ve referenced the last few days.
As stated in yesterday’s Morning Trends, triggering one pattern would wreck the others. The potential short-term top has been clearly negated…
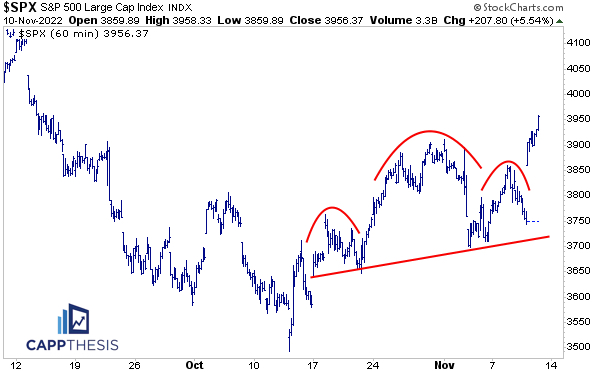
… while the potential bigger top looks close to being nullified, too. A quick rollover would keep the structure intact, but it would need to happen soon.
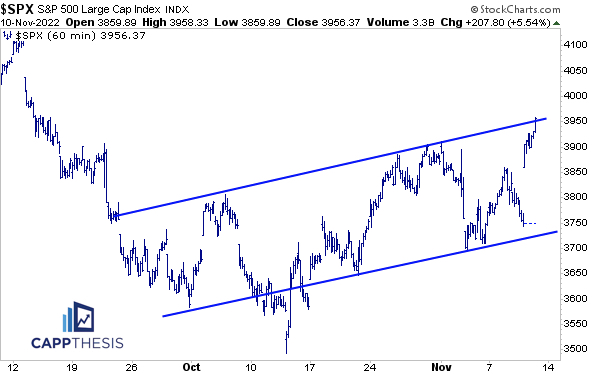
Short-term, we should monitor this trading channel, as the SPX finished near the top of it yesterday. While the patterns have been whipsawed, the rally’s general slope has remained the same since late September (other than the 10/13 aberration).
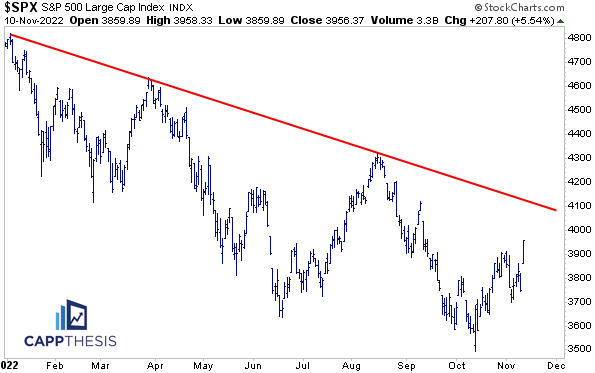
If the SPX can hold the 3,900-breakout zone and continue higher, it eventually would get back to the YTD downtrend line, too. That’s currently near 4,100.
Lastly, if ALL of that plays out, the NEXT step would be forming a much, much bigger foundation like this. Again, this is not a prediction of what will happen; rather, it’s a blueprint of the best case scenario for a constructive comeback.
SPX, US Dollar, 10 Year Yield
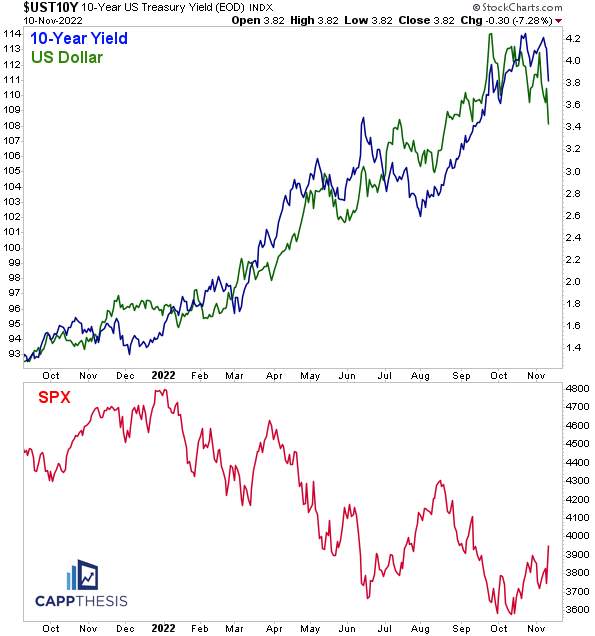
If the SPX’s bottoming formation is going to work out, it will be courtesy of the topping formations playing out in the US Dollar and 10 Year Yield. This concept is well understood but significant, nonetheless.
US Dollar
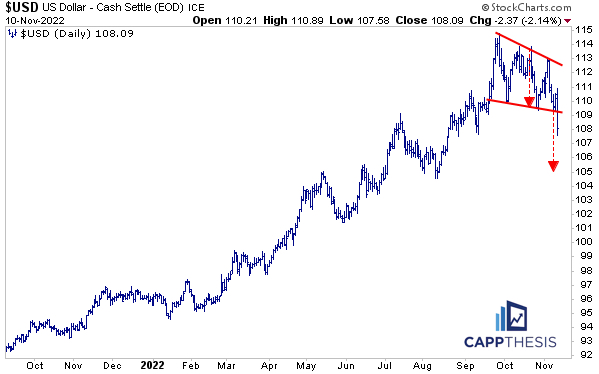
For the Dollar, the breakdown target is clear.
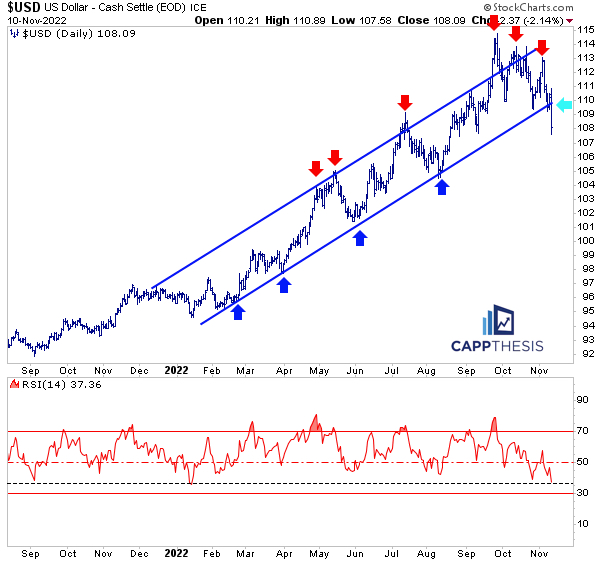
Another view shows that the Dollar is at the farthest below its upward sloping channel of the year. Ditto for its RSI indicator.
At the very least, this action has made the area from 110-115 a formidable supply zone.
HYG Yield Bonds
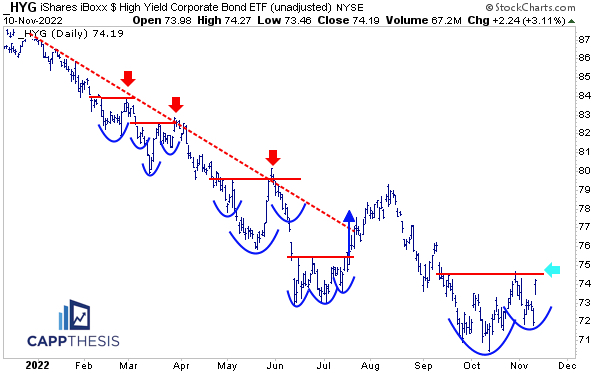
HYG is off its lows but has yet to break above its October high point. Only one bullish pattern has proven successful in 2022 so far…
