Key Points
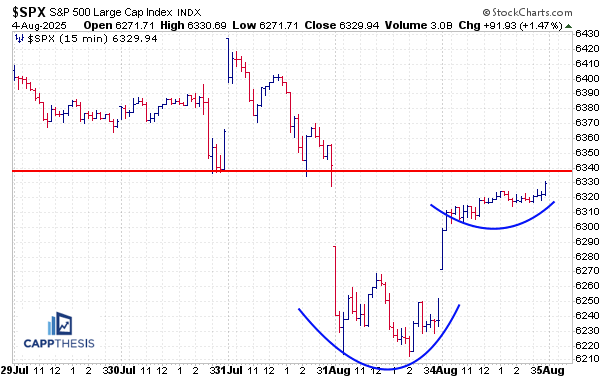
The S&P 500 snapped back in impressive fashion to begin the week, with yesterday’s 1.5% gain almost completely erasing the 1.6% decline from last Friday. As we can see on the intraday chart, the index is trading just below the lows from the Fed meeting and the day after.
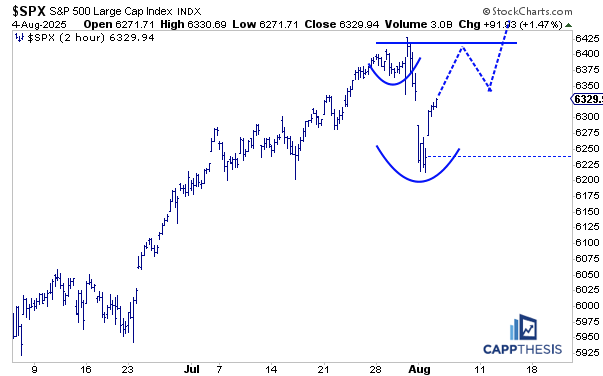
From a pattern perspective, there appears to be a small potential bullish cup-and-handle formation taking shape over the last two sessions.
We’ll be taking a closer look at what this all means for volatility, patterns and trend, along with several key ETFs and our first chart trade of August.
Last Five Trading Days
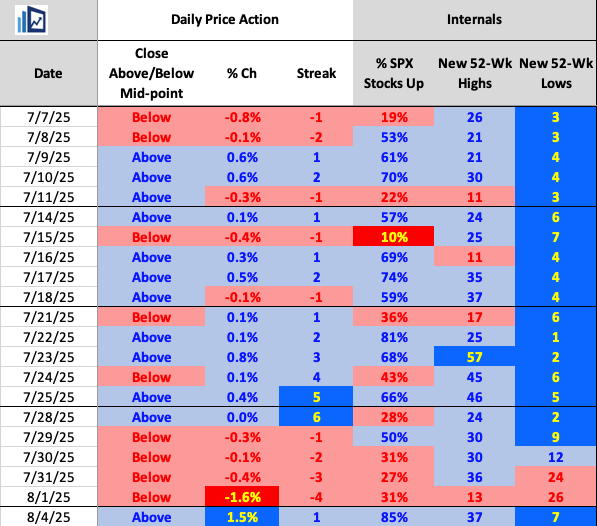
Daily Price Action
The strong bounce yesterday helped break the index’s four-day losing streak—the longest since the slide from May 20–23. The last longer losing streak was back in February, when the S&P fell six straight days right after tagging its all-time high on 2/19/25.
Yesterday’s breadth was also impressive, with 85% of S&P 500 stocks advancing—the strongest since 93% participation on May 27. The last time we saw back-to-back 80%+ advancing days was from April 11–14.
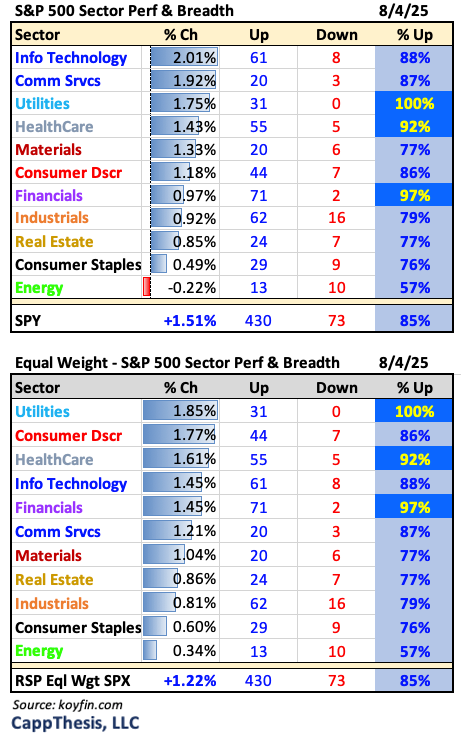
Sectors
All 11 S&P sectors posted positive breadth, with Utilities leading as all 30 of its components advanced. Healthcare and Financials also saw 90%+ participation, while Energy was the only laggard—albeit with just a marginal decline.
Breadth
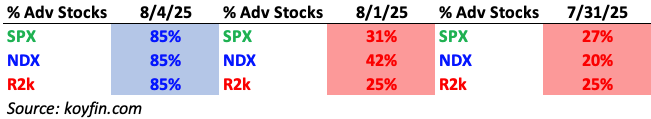
The SPX, Nasdaq 100, and Russell 2000 each posted 85% advancing stocks—the first time we’ve seen that kind of synchronized strength since June 6, which happened near the start of a strong monthly run.
Best & Worst 20 ETFs
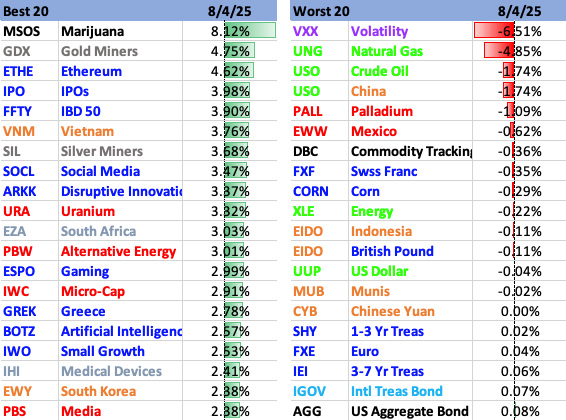
Naturally, a number of key ETFs we track had very strong showings on Monday. Growth led broadly, but we also saw strength in Cannabis, Miners, and Alternative Energy. On the downside, VIX fell along with Energy, select commodities, and some foreign indices.
Snapback
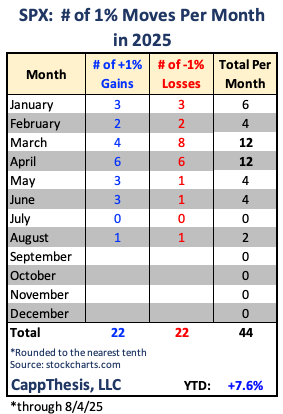
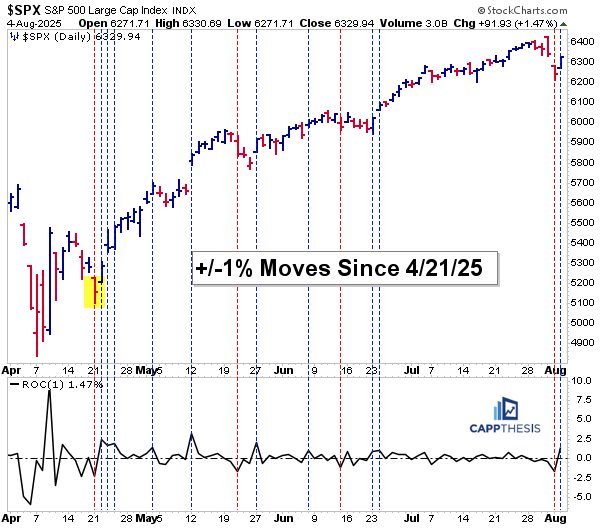
So, two days into the month, we’ve already seen both a 1% drop and a 1% gain—a sharp contrast to July, which saw zero 1% absolute moves. That type of quiet action is rare and last occurred in November 2019, so a reversion to volatility in August shouldn’t surprise anyone.
There’s still a long way to go, and what matters most now is how the market responds to enhanced price swings from here…
Here’s an updated chart showing all of the 1% declines so far in 2025. A lone 1% loss after nearly seven weeks without one doesn’t look ominous. Since the third week of April, we’ve only had three 1% down days, and the market has been grinding higher in calm fashion. This environment has supported breadth and, more importantly, the formation of bullish patterns—many of which we’ve been tracking and acting on.
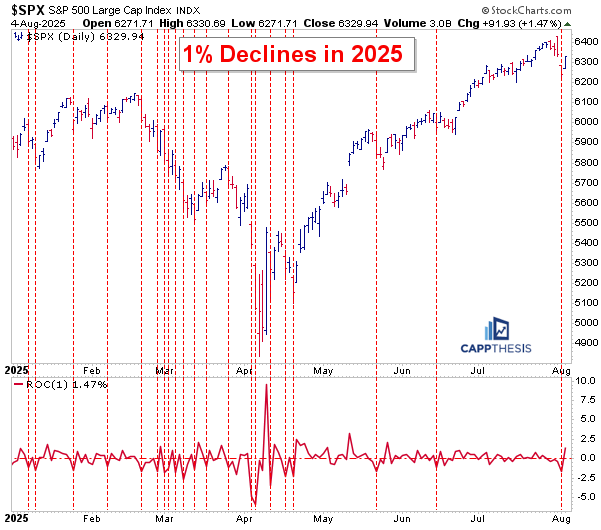
Zooming in on the action since April 21, that’s when things truly changed. It started with a big down day, but the market pivoted and closed near the midpoint of the daily range. From there, the S&P 500 logged three consecutive 1% gains on its way to the longest winning streak of the year—nine straight sessions.
Since then, we’ve seen only shallow pullbacks, the largest being just 3.5% in mid-May. Notably, after each of the three 1% declines, a strong rebound followed almost immediately:
- Two sessions later in May
- Five days later in June
- And the very next trading day following Monday’s drop—yesterday
This pattern clearly reflects an investor appetite to buy every dip, a behavior we must respect—until it changes.
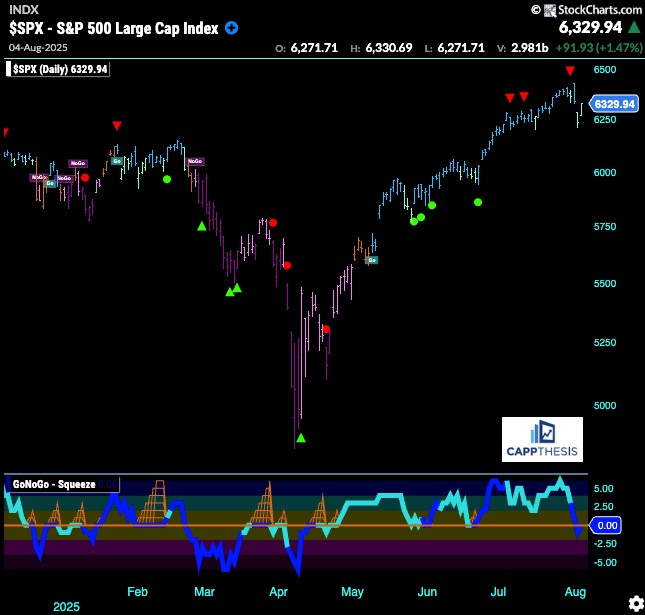
GoNoGo Trend – Daily
So far, the counter-trend signals that have appeared on the GoNoGo chart have also led to buy-the-dip behavior.
As we’ve reviewed in the past, this very same dynamic was prevalent throughout much of the rally from late 2023 through March 2024, as the market extended higher in a very consistent and orderly fashion—much like what we’ve been seeing again over the last several months.
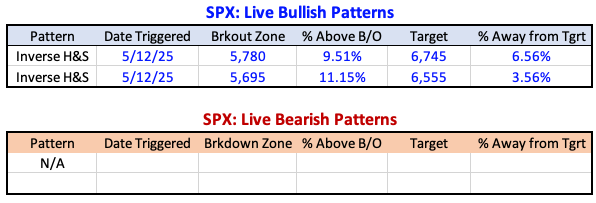
Live Patterns
Our two live bullish patterns remain – targets of 6,555 and 6,745, which could be with us for a while going forward. For those to eventually get achieved, though, new, smaller versions will need to be constructed.
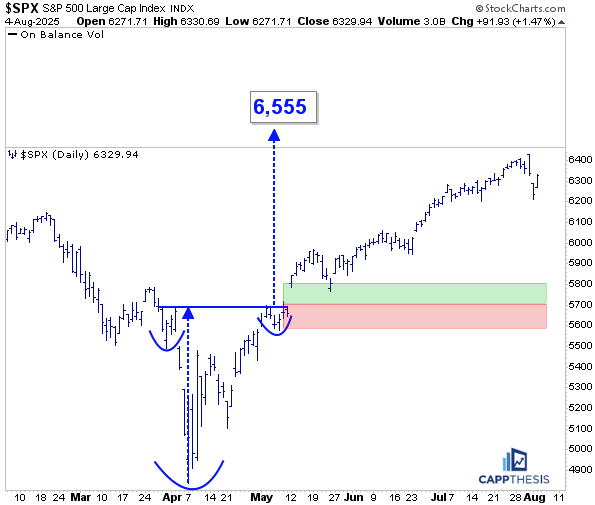
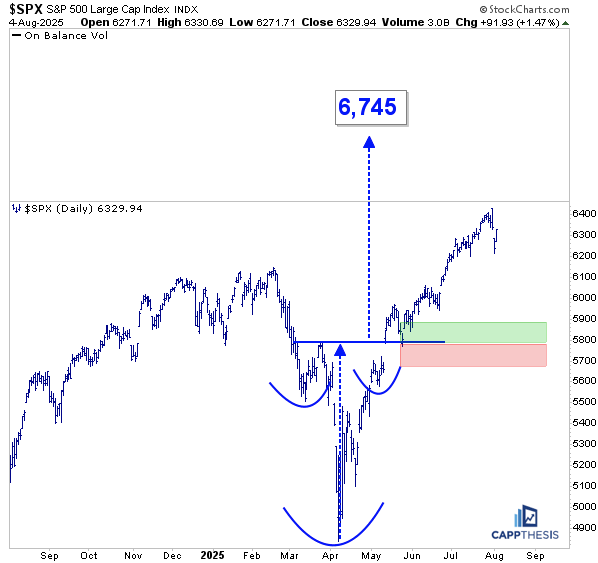
Potential Patterns
The next phenomenon we’ll be watching from a technical perspective is how the ensuing short-term bullish patterns begin to take shape.
Below are two versions of the same chart, and what’s clear is that a bounce wasn’t unexpected—even though it came faster and stronger than most anticipated yesterday. From here, a further extension could potentially take the index back toward the former highs, opening the door for the formation of a smaller bullish continuation pattern—something we haven’t seen in several weeks.
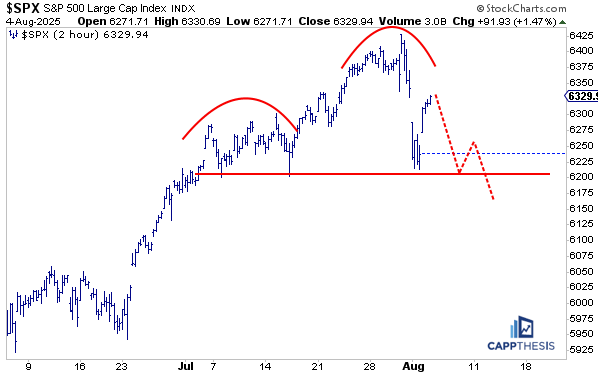
That said, we also have to consider the alternate scenario: this bounce may stall, forming a lower high, which could resemble the right shoulder of a potential bearish head-and-shoulders pattern. We haven’t seen anything like that develop since March, but it remains on our radar.
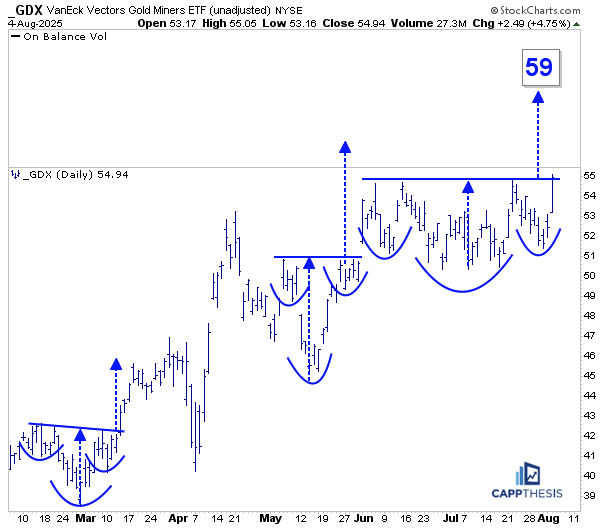
GDX Gold Miners
GDX, was among the leaders yesterday, which allowed the ETF to come close to completing the potential inverse head-and-shoulders pattern we’ve been tracking over the past few weeks.
While it’s under pressure this morning, the pattern should remain on our radar, especially given that GDX has flatlined over the last two months but continues to hold near its highs.
As we’ve seen, the ETF has done a very good job in 2025 of capitalizing on bullish technical patterns, and this setup could be just the next in that sequence.
IHF HC Providers
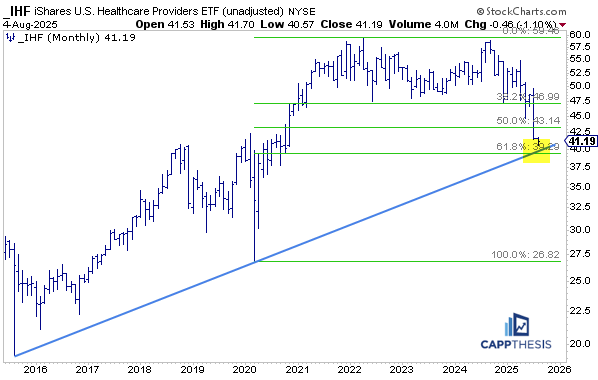
Yesterday, we reviewed over 20 key ETFs as part of our monthly roadmap for August. One ETF we didn’t discuss, but that now demands our focus, is the IHF (Healthcare Providers ETF).
IHF was one of the worst performers in July, and understandably, not many investors want to touch it right now. But that may be exactly why it’s worth watching. The ETF has now returned to a critical support area, currently testing a long-term uptrend line drawn from the 2015 lows, which also connects the COVID low—and it just so happens to align with the 61.8% Fibonacci retracement of the 2020–2022 rally.
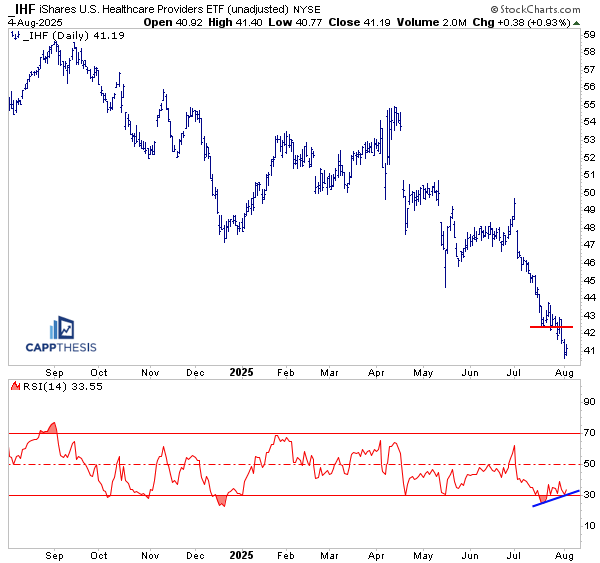
On the short-term chart, IHF has been making lower lows, but over the past week, its 14-day RSI has been making higher lows—a classic sign of potential positive momentum divergence.
To be clear, IHF remains in a long-term downtrend, but from a mean reversion perspective, this is a setup worth watching.
Support could at least produce a tactical bounce. A bullish pattern can’t form unless we first get a rally off the lows—and that’s the essential first step in any potential turnaround.
ESPO eSports & Gaming
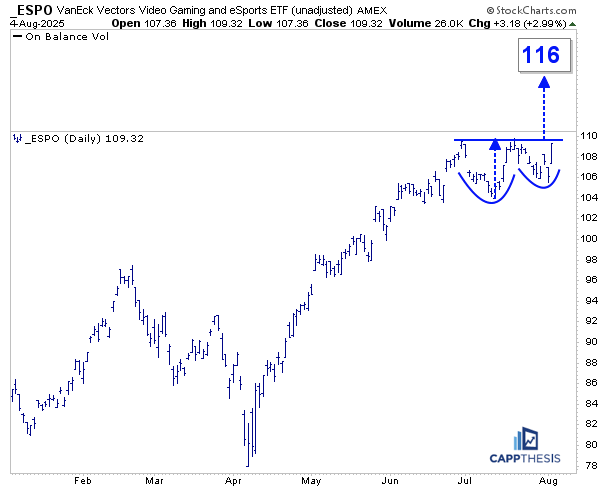
ESPO was up nearly 3% yesterday and has now come close to completing a small but very clear potential cup-and-handle pattern. The key here is that it was able to hold support following a rather steep pullback in July.
This is a bullish signal, suggesting buying interest at key levels, and it sets the stage for a potential breakout to new all-time highs—if the pattern confirms with a clean move through resistance.
ETHE Ethereum
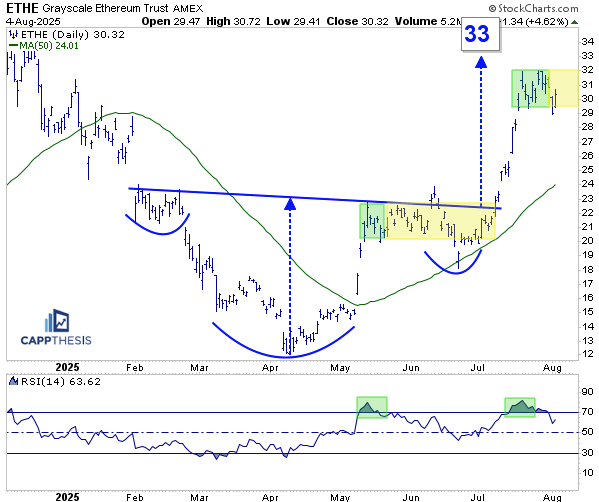
Checking in on ETHE, we noted that after an initial pause, it appeared to be forming a potential bullish flag pattern. We previously pointed out how similar behavior followed a breakout earlier this year, which ultimately extended through early July before that consolidation phase was fully resolved to the upside.
So far, THE has held near its highs, but it has not yet capitalized on that initial pause. We’ll continue to monitor it, and as long as it holds around current levels, there remains a solid chance it could break higher, potentially making a move back toward multi-year highs.
From an RSI perspective, we’re once again seeing the indicator hover around the 50 zone. If price continues to move sideways, this level will be important to watch. A similar setup occurred in June, which eventually supported the next leg higher shortly thereafter
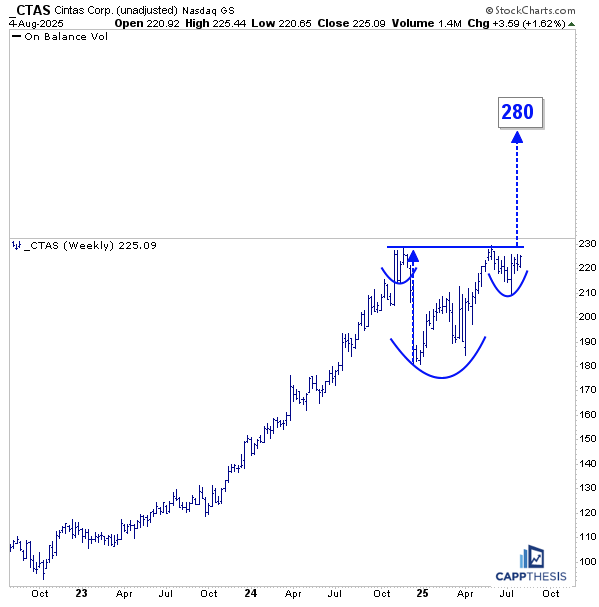
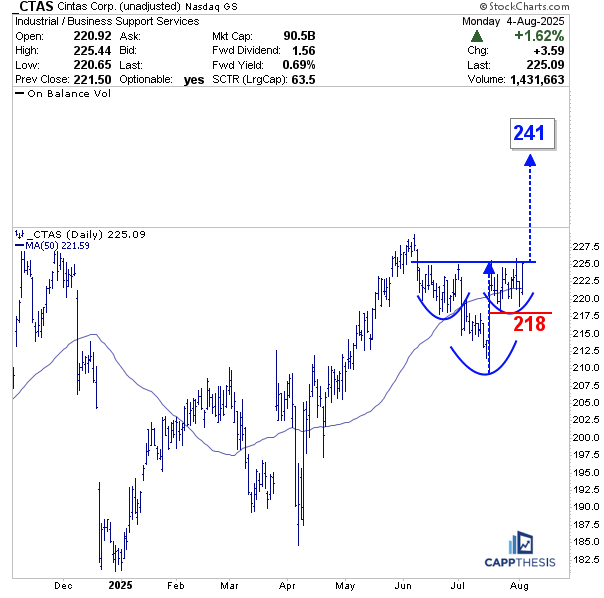
CTAS Cintas
We’ve profiled CTAS before in the Chart Trades section—it remains extremely strong and firmly in a long-term uptrend. Over the last few weeks, it has begun to form a potential inverse head-and-shoulders pattern.
The company reported earnings a few days ago, and after the typical post-report volatility, the stock is now back to challenging a key resistance level. A breakout above the 225 zone would trigger the pattern, with a measured move target near 241—which would mark a new all-time high by a fair margin.
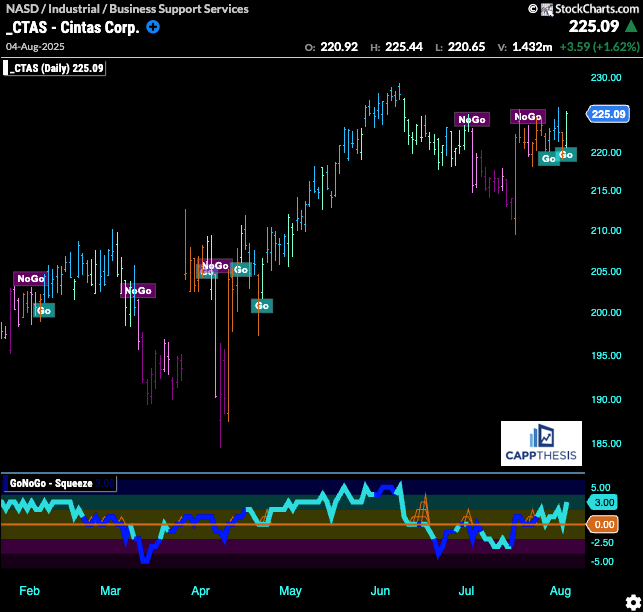
The GoNoGo chart had been whipped around a bit following the July pullback, but over the last few days, it has strengthened and now appears to be back in “Go” mode once more.
Of course, as we know, any signal needs more than one day of confirmation, and this indicator is no exception. Still, with price approaching a potential breakout zone and moving close to former highs, the momentum could turn and remain strong—as we’ve seen in the past with this cart and this stock.
Zooming out to the weekly chart, we can see the stock is also forming a much larger potential inverse head-and-shoulders pattern. A breakout above the April highs would confirm this pattern and generate a measured move target up near 280—a significantly higher level that would mark a major technical milestone