Key Point:
Consistently having live bullish patterns and targets in play tells us that we’re in an uptrend. And if the market is in an uptrend, we should be looking for bullish trade ideas.
Topics Covered:
Market
-Our market stance
-Pattern grid
-Three live bullish patterns
-Two potential patterns
-AVWAP
Daily Stats
-Daily price action
-Index breadth
-Sector performance
-Best & worst ETFs
Key Charts
-MAGS
-XLE
-XLF
Intra-Day
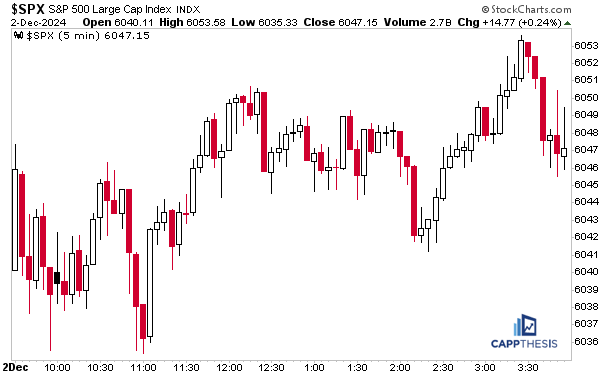
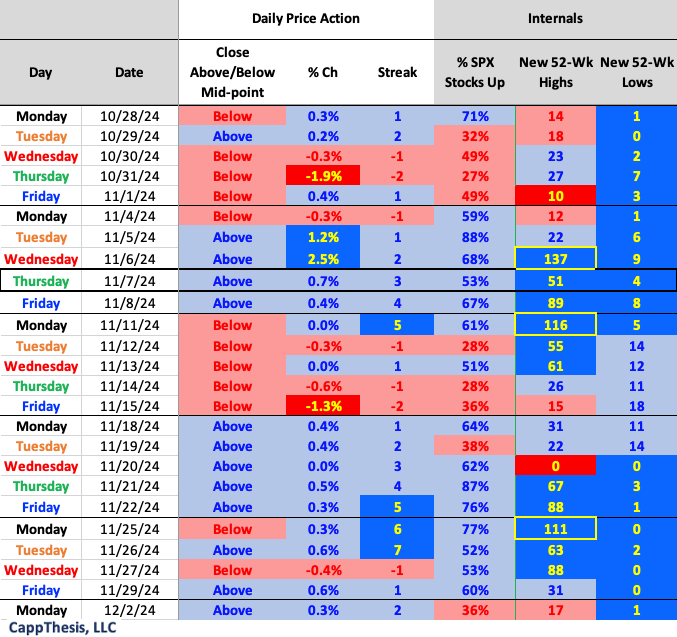
The SPX closed higher for the ninth time in 10 days on Monday, with each advance being less than 60bps. The index finished above its intra-day mid-point for the eighth time within the same period, as well.
But SPX breadth was poor overall with only 36% stocks advancing, which was the worst showing since 11/15 (also 36%). Financials, Energy, Real Estate and Utilities all were down at least 1%.
Our Market Stance
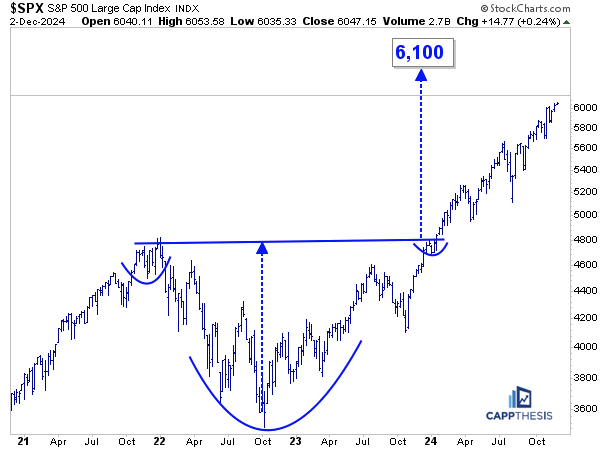
All that said, the index again did enough to pull itself a little closer to 6,100, finishing the day within 0.87% of the big pattern target.
We show the below pattern grid every day to keep the live formations and objectives fresh in our minds. In fact, this is the main factor in determining our market stance.
Consistently having live bullish patterns and targets in play tells us that we’re in an uptrend. And if the market is in an uptrend, we should be looking for bullish trade ideas. This is reflected in the key ETF charts we discuss at the end of every Opening Look report, within the weekly and monthly Roadmap pieces and, of course, inside the Chart Trades’ stock trade ideas note, too.
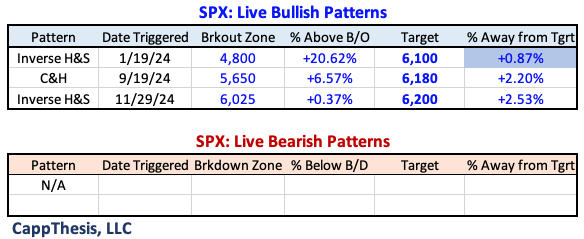
It’s no coincidence that seeing very few live bearish patterns on the grid has prevented us from suggesting many bearish trades. This will change at some point, but it hasn’t yet. Again, what is the point in guessing when we have this as a guide literally telling us what is working and what is not?
Yes, there have been pullbacks when the market has gotten short-term extended, which we frequently reference. However, we care most about the major trends and trend shifts. And when those happen, the table will look a lot different.
The pattern grid also alerts us to the severity of the market’s gyrations. Intense whipsaws would wreck fresh breakouts and negate upside targets. As we know, we’re now up to 10 successful bullish patterns after the SPX hit the 5,900-target last month.
With the market having extended immediately after the 9/19 breakout, the higher 6,180 target has remained in play, too.
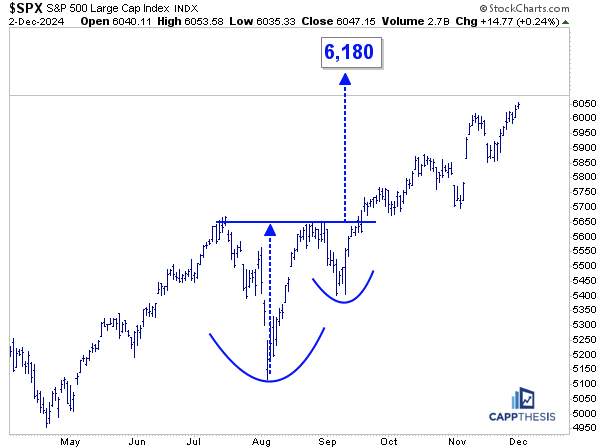
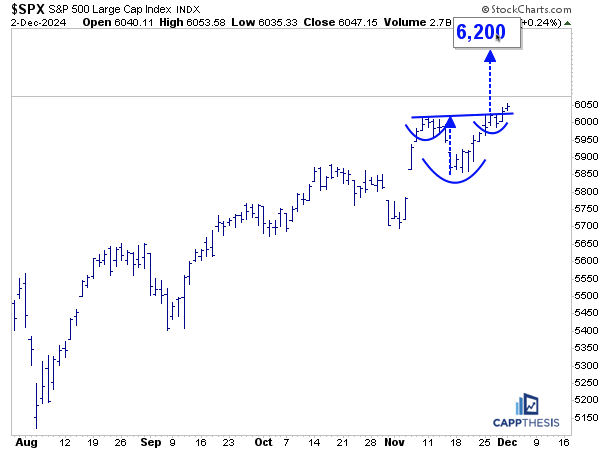
The last few days of slight upside was enough to trigger the latest (albeit smaller) bullish formation, which has a target of 6,200. Like all freshly completed patterns, this one is tentative and will be negated with a prospective pullback under the breakout zone (6,025).
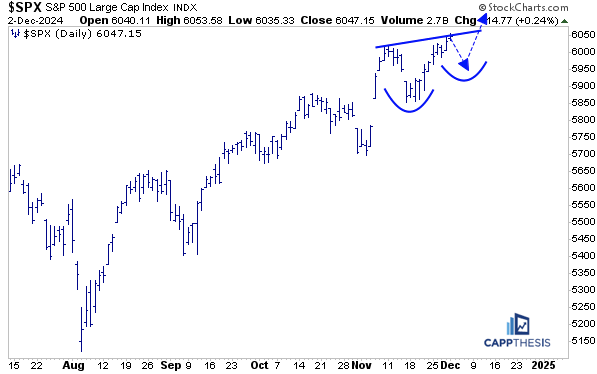
That being the case, something like this could then form instead…
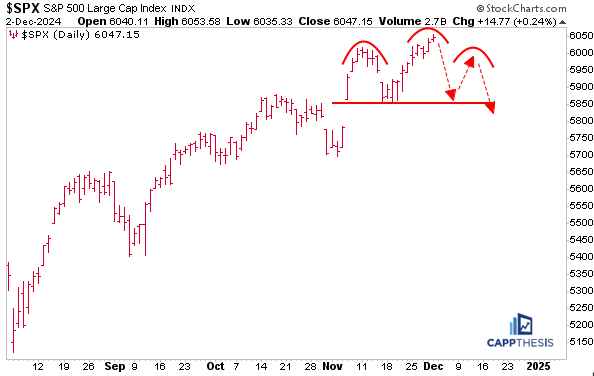
Of course, we always have an eye on the potential bearish setups. A failure near the highs and immediate downside follow through would keep this one alive.
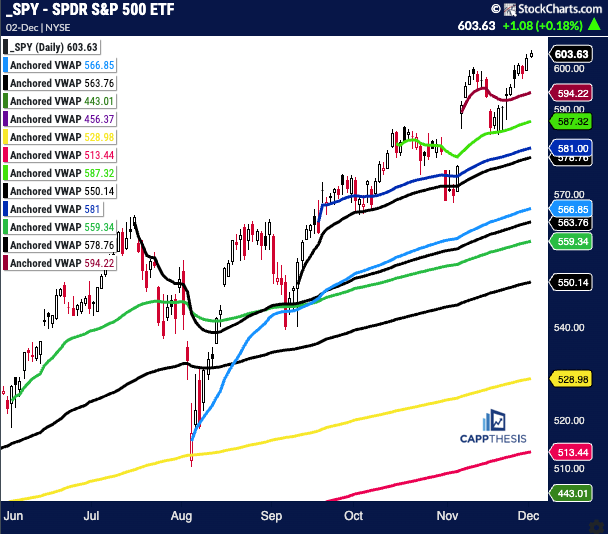
SPY AVWAP
SPY remains above all key VWAP lines.
SPY
Red: 11/6/24 – Election spike
Light Green: 10/15/24 – Bearish engulfing pattern
Blue: 9/18/24 – Fed cuts rates 50 bps
Black: 9/12/25 – CPI, positive reversal
Light Blue: 8/5/24 – Pivot low
Red: 10/31/24 – Gap lower
Black: 7/16/24 – July’24 high
Green: 5/31/24 – Pivot low
Black: 4/19/24 low
Yellow: 1/2/24 – YTD VWAP
Pink: 10/27/23 – October’23 low
Purple: 1/4/22 – 2022 high
Green: 10/13/22 – 2022 low
Daily Price Action
The 17 new 52-week highs were the least amount since 11/20.
Breadth
The NDX and R2k both had approximately 60% stocks advance yesterday despite the SPX’s sub-par internal showing.

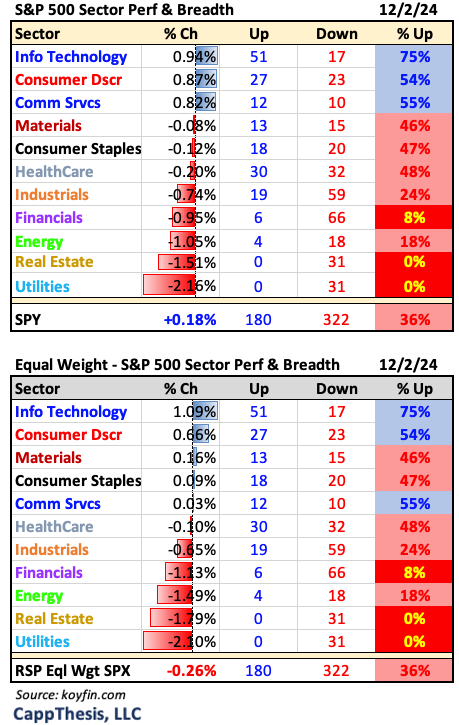
Sector ETFs
The three growth sectors were the only ones with positive breadth yesterday.
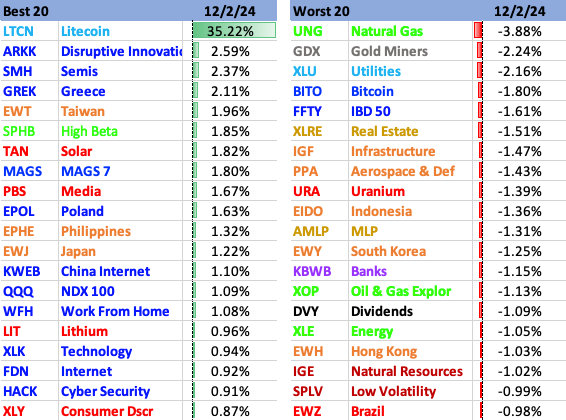
Best and Worst 20 ETFs
Growth led our ETF universe, too.
MAGS
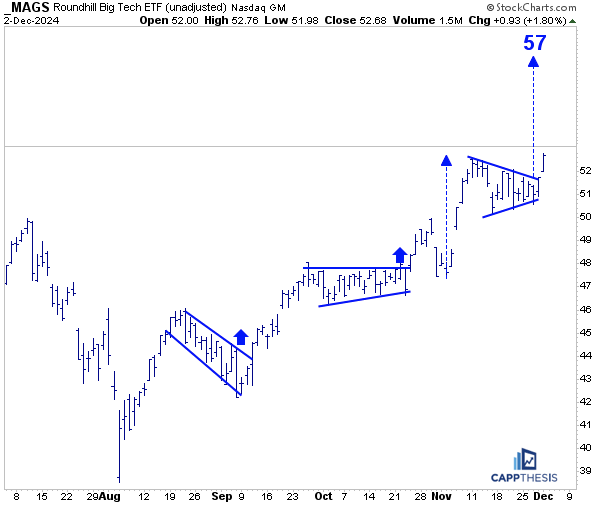
With the biggest growth stocks leading yesterday, the MAGS ETF benefited in a major way. It broke out to new all-time highs and triggered the potential bullish pennant formation we referenced last week. The objective now is at the 57-level.
XLE Energy
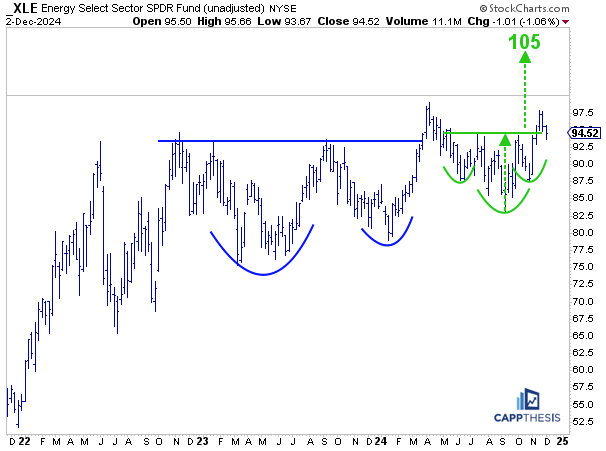
XLE Energy was down 1% to start the week, but it closed above its intra-day lows, thus, the inverse H&S pattern breakout from November remains in play. The target is way above its multi-year highs at 105.
XLF Financials
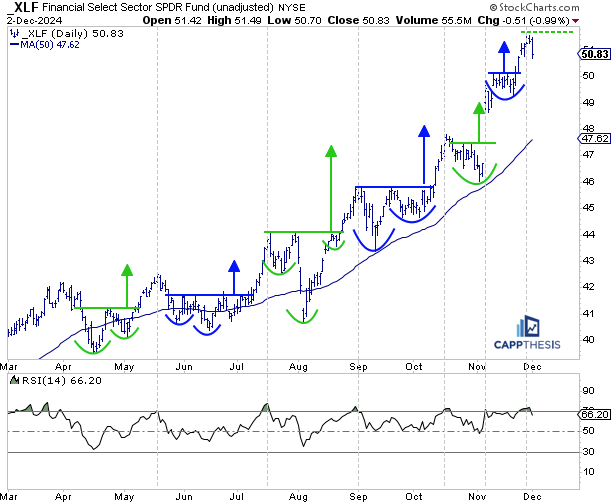
XLF had a bad start to the week, too, but considering the run it has had, this is understandable. For most of 2024, XLF routinely has done the following: formed bullish patterns, broken out, hit upside targets, gotten overbought, digested the gains and formed new bullish patterns.
Noted are the times when XLF has simultaneously hit a bullish pattern target and had an overbought RSI reading. Periods of back-and-forth action followed each time. It would not be surprising to see the same kind of behavior replicated again now.
