Key Point:
Given that the SPX is coming off the best weekly gain in over a year, it’s not outlandish to call this market short-term stretched. Seeing some consolidation soon would help new patterns to take shape. Below are a few charts showing how far last week’s big reaction has taken the SPX the last few days and what it could mean going forward.
Topics Covered:
Market
-Short-term momentum
-Trading channel resistance
-SPX vs. 20-DMA
-Overbought S&P 500 stocks
-Live patterns
-AVWAP
Daily Stats
-Daily price action
-Index breadth
-Sector performance
-Best & worst ETFs
Key Charts
-ARKK
-Ethereum (2)
-Semis
-Gold Miners
Intra-Day
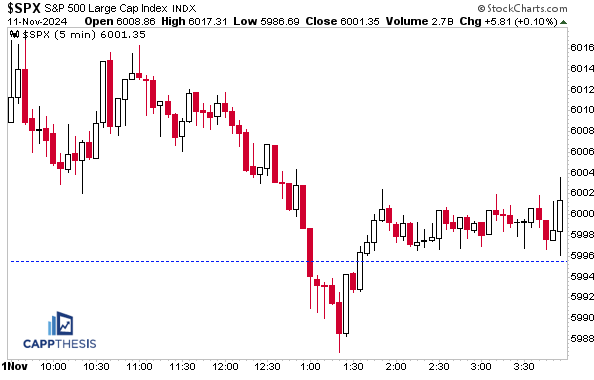
The SPX squeaked out a 10-bps gain on Tuesday to log its fifth straight advance. This now is the longest since seven-straight from 9/9 – 9/17. With the bond market closed yesterday and no new data being released, the fireworks were minimal, at least within the major indices.
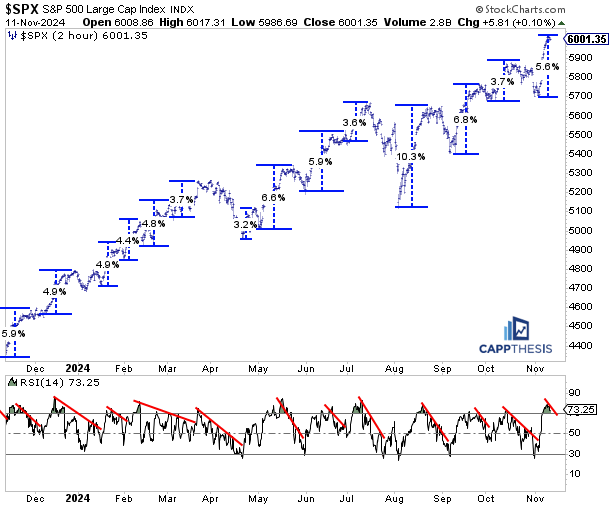
Short-term RSI
It seems like a long time ago now, but we’ll recall that the SPX ended October with a harsh 1.9% decline. That was one of the worst losses of 2024 and flipped the monthly performance from positive to negative. But it didn’t persist.
And now the SPX is up over 5.5% since that October 31st intra-day low point, which quickly pulled the 14-period RSI on the two-hour chart from oversold to overbought territory. The indicator has been above 70 for three days, which has been a fairly long stay over the last 12 months.
We’ve displayed this chart dozens of times over the last year, and what it really shows is the ebb and flow of an uptrend. At times, the SPX has gotten overheated (like now) and needs to regroup. No one would deny that a breather would be welcome. In fact, said breather may already have started with gains of just 40bps and 10bps the last two days.
Short-term Trading Channel
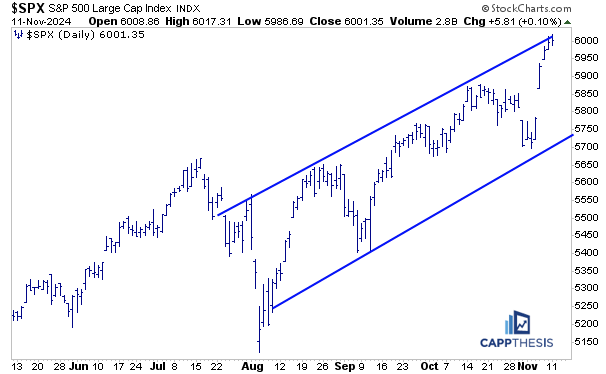
Yesterday we discussed how the SPX ended last week once again above its two-year trading channel. It’s now near the upper edge of a THREE-MONTH trading channel, too.
Again, an ensuing big decline is not a guarantee just because it’s near this line – nor is it a necessity. But seeing the index simply repeat last week’s pace and shoot way above the upper threshold without a break would be surprising.
SPX vs. 20-Day Moving Average
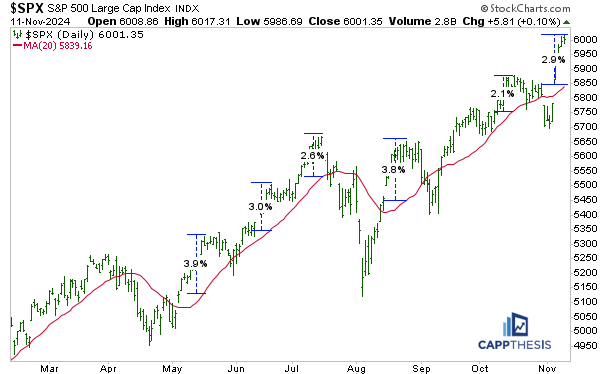
Last week’s pop pulled the SPX back above its 20-day moving average, which is a bullish development. During the best trading environments, the index trades above the short-term line the majority of the time, with downside breaks being temporary. That proved to be the case again this time.
The snap back now has put the SPX nearly 3% above the 20-day line, which is among the biggest discrepancies in 2024. This can be normalized through price or time: 1-a sizable decline clearly would do the trick or 2-as just discussed above, an innocuous pause soon would allow the 20-DMA to catch up to the index, as well.
Overbought S&P 500 Stocks
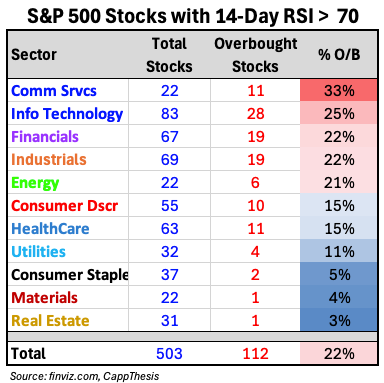
Despite these short-term metrics being stretched, the SPX’s 14-day RSI still isn’t officially overbought: it’s close at 69.16.
But many of its components are…. According to finviz.com, 112/503 have RSI readings above 70 (22%). Technology has the most with 28, while Comm Service has the greatest percentage of overbought holdings with 33%.
We’re the first to admit that being overbought is NOT bearish, and when the number of overbought stocks gets this high, it reveals how strong the foundation has gotten. But it also tells us that short-term momentum could be due for a slowdown.
Live Patterns
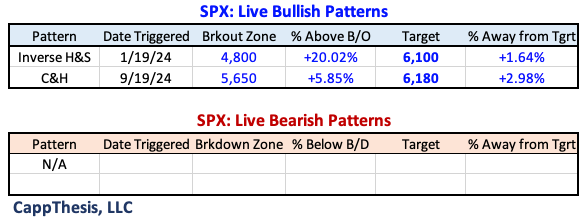
Two live bullish patterns remain – targets 6,100 and 6,180.
SPY AVWAP
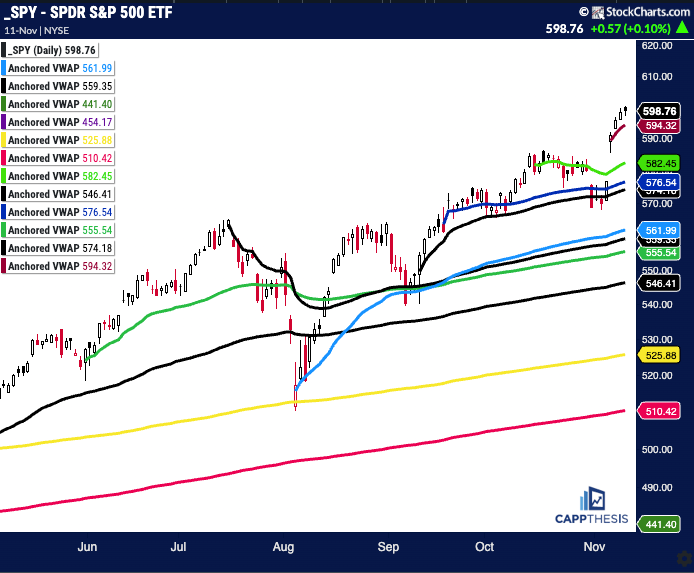
SPY remains above all key VWAP lines.
SPY
Red: 10/6/24 – Election spike
Light Green: 10/15/24 – Bearish engulfing pattern
Blue: 9/18/24 – Fed cuts rates 50 bps
Black: 9/12/25 – CPI, positive reversal
Light Blue: 8/5/24 – Pivot low
Red: 10/31/24 – Gap lower
Black: 7/16/24 – July’24 high
Green: 5/31/24 – Pivot low
Black: 4/19/24 low
Yellow: 1/2/24 – YTD VWAP
Pink: 10/27/23 – October’23 low
Purple: 1/4/22 – 2022 high
Green: 10/13/22 – 2022 low
Daily Price Action
We’ve now had two days of 100+ SPX names making new 52-week highs in the last four trading sessions. That’s the tightest cluster since the uptrend began a year ago.
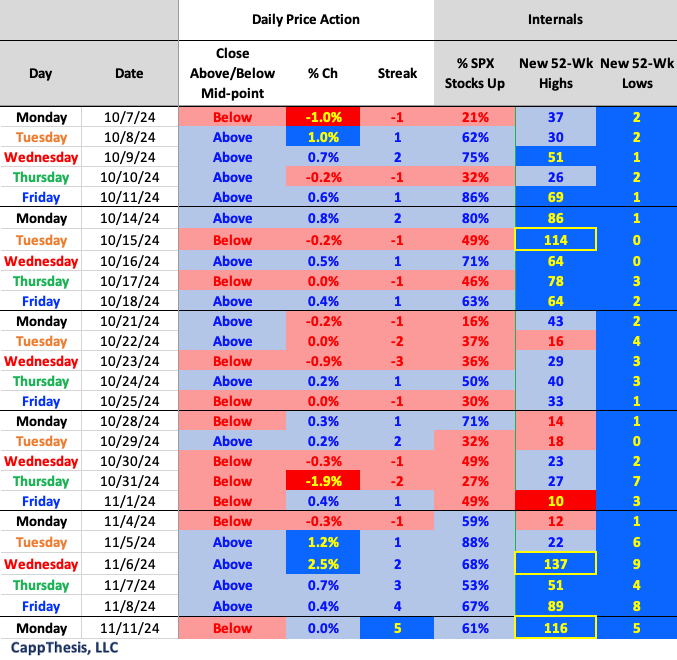
Breadth
R2k led on Monday.

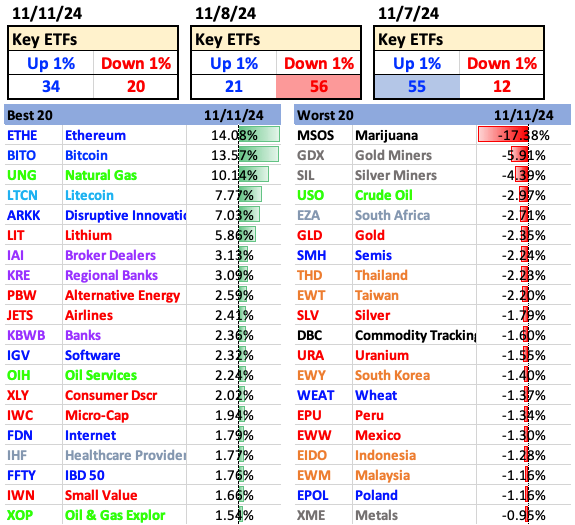
Best and Worst 20 ETFs
Crypto, financials and select growth led yesterday.
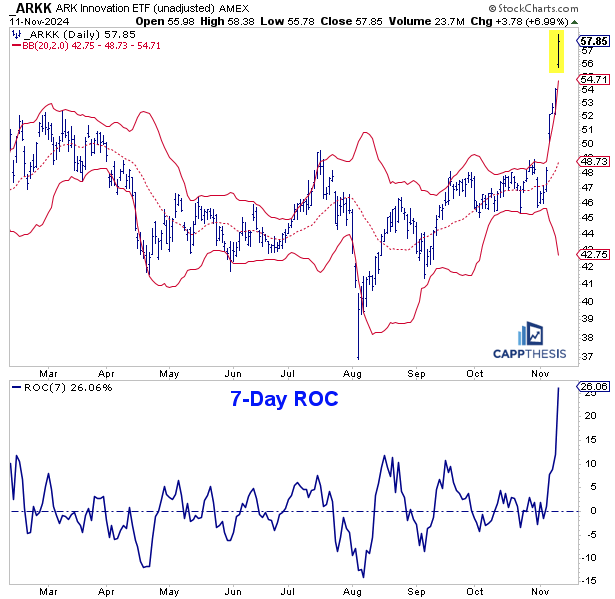
ARKK
ARKK logged its seventh straight gain yesterday and is +26% over that time – this encompasses all of November so far. Its last seven-day winning streak happened from 5/26–6/6/23, which took place in the middle of an ultimate 48% multi-month gain. The last LONGER streak was NINE in a row from the period ending 6/29/21.
As is clear, the ARKK ETF is WAY above the upper Bollinger band now, which obviously isn’t sustainable. It’s all about how the first pullback is treated from here. Holding near 50 will be very important.
Ethereum
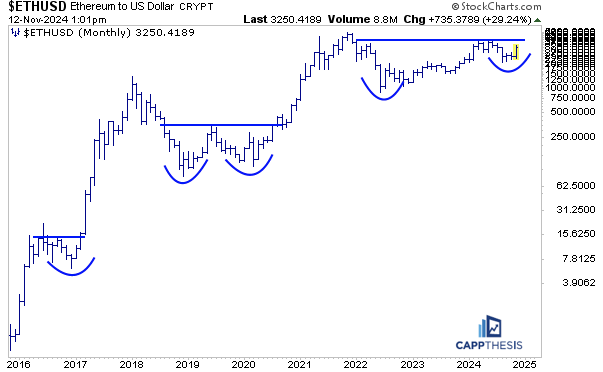
Ethereum hit the 3,310-pattern target with the recent spike discussed last week…
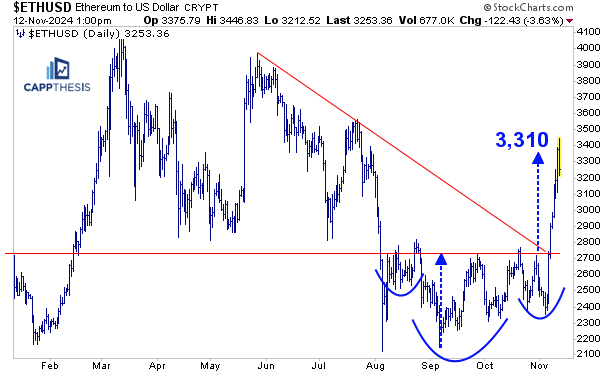
The much bigger pattern is this one – Ethereum would need to break above 4k for it to be triggered.
SMH Semis
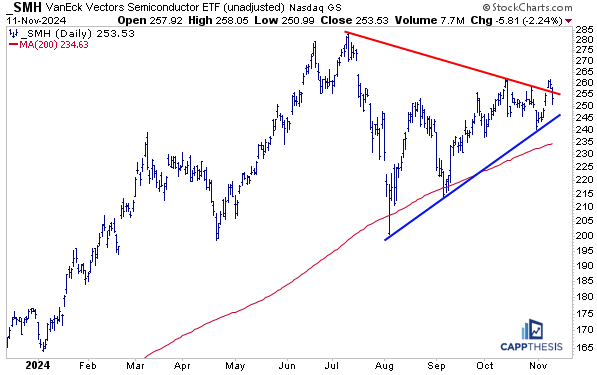
SMH logged its worst decline of November yesterday, dropping 2.2%. It’s now back below the downtrend line from the July high point, which it spent just a few days above last week. It’s important for SMH to hold the upward-sloping line of the clear and big symmetrical triangle pattern now.
GDX Gold Miners
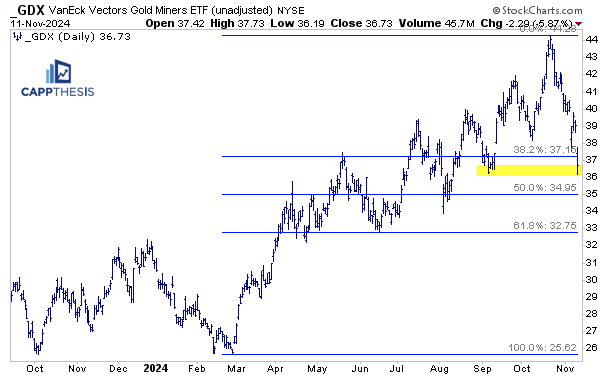
GDX’s decline from its October peak now measures -17%, which noticeably is much worse than the prior multi-week sell-offs we’ve been referencing lately. Thus, it was good to avoid buying the breakout to new highs a few weeks ago, but we’re still waiting for a legitimate price-flip for positive momentum to return.
The ETF is near early-September support now, which is between the 38.2% and 50% retracement zones. The 200-DMA is near 35, too (not pictured).
