Key Points:
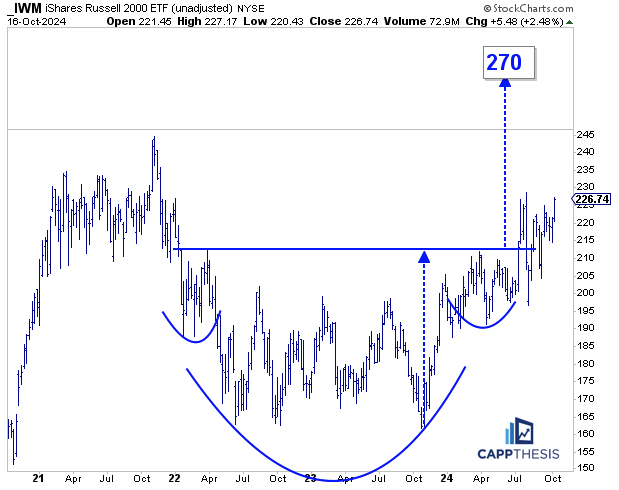
1- IWM broke out from the daily bullish pattern and has a target of 253.
2- The recent comeback also has retriggered a weekly bullish formation, which has an upside objective up at 270.
Topics Covered:
Market
-Intra-day
-Small Caps deep dive
-Live patterns
-AVWAP
Daily Stats
-Daily price action
-Index breadth
-Sector performance
-Best & worst ETFs
Intra-Day
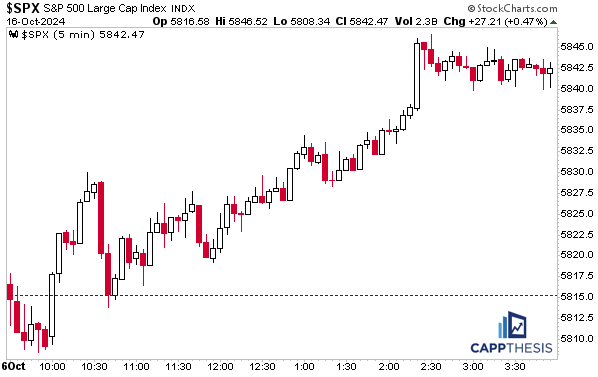
The SPX once again rebounded from a down-day with a modest 47-bps gain and a close on its highs. The index hasn’t logged two straight declines in 27 trading days now – since the four-straight from the start of September. This is the longest such run (by a lot) of the entire uptrend from last October’s low. Needless to say, it has been even stranger given that this is happening during a typically highly volatile period…
The Small Caps’ Fourth Breakout Attempt
We’re focusing on Small Caps today given that they have been leading from both a performance and breadth perspective over the last week. While we haven’t seen the IWM, IWO or IWN on the ETF new high list, that could change soon.
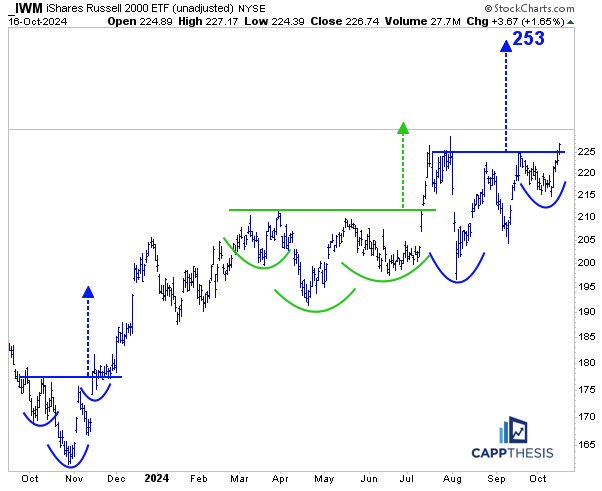
IWM, the R2k ETF, broke out of the daily chart pattern we profiled yesterday. The question now is whether the fourth attempt at staying above 225 will be enough to encourage necessary follow through.
The first try, of course, happened during that historic spike in July, which ended up being short-lived given the market-wide volatility a few weeks later. But a hold above 225 now would keep the 253-target in play.
Now vs. July
So, how different is this attempt from what we saw three months ago? First, it IS three months later. In other words, IWM is net flat since July. Yes, it’s up a lot over the last few days, but not compared to the parabolic action from this past summer.
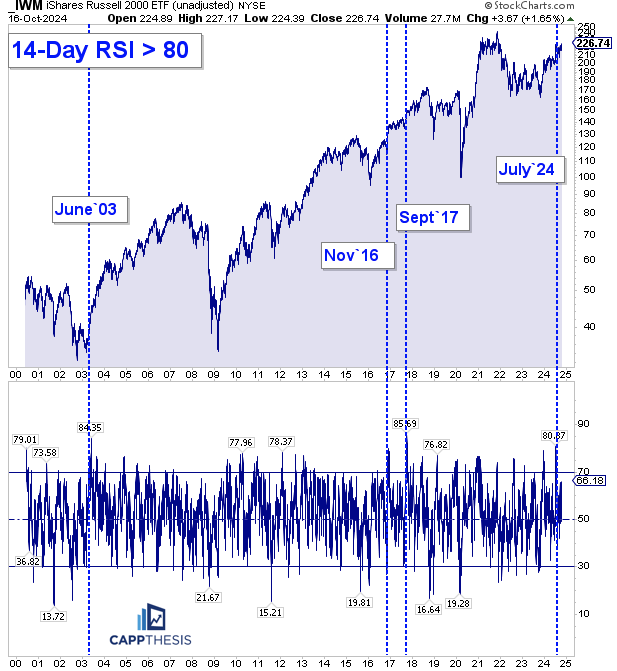
We showed the below chart back then, noting that its 14-Day RSI shot all the way up to 80 for only the fourth time since 2000 – 24 years ago. The move was due to be digested. Said digestion phase has lasted a lot longer than traders would have liked, but the best-case scenario ultimately has resulted. It has come back and has formed a clear bullish chart formation, which it now has the chance to leverage.
The Weekly Breakout
As we talk about a lot, successful bullish patterns in the daily work often help build bigger foundations. Thus, the comeback also has re-triggered the much larger inverse H&S pattern, which has a target all the way up at 270.
Big Moves Before & After Major Breakouts
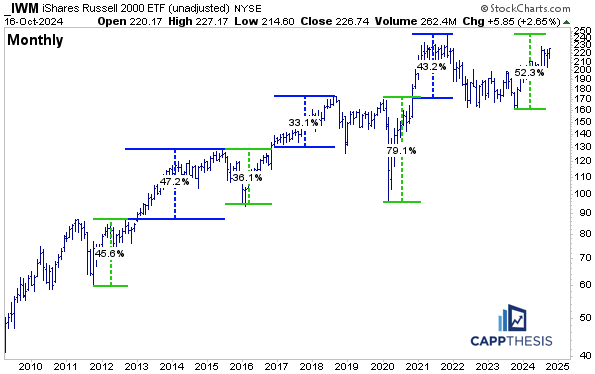
IWM is approximately +40% from the October’23 low point, which is a lot. In fact, this just about matches the S&P 500, which now is +41% from its own low nearly 12 months ago. How much further can we expect it to actually gain after such a run? Well, if IWM replicates what it has done in the past, then we could see a good deal more upside.
First, if/when it returns to the last all-time high point from November 2021 (242), IWM would be up more than 50% from the same October’23 low. It’s experienced similar strong moves from key lows over the last 15 years to get back to recent high points… and then tacked on substantial gains in the months and years that followed. We know every time is different, but these past examples shouldn’t be ignored.
IWM vs. SPX
So, we’ve established that IWM now has two live bullish patterns (daily and weekly) and that getting through its last high could encourage follow through based on its recent history.
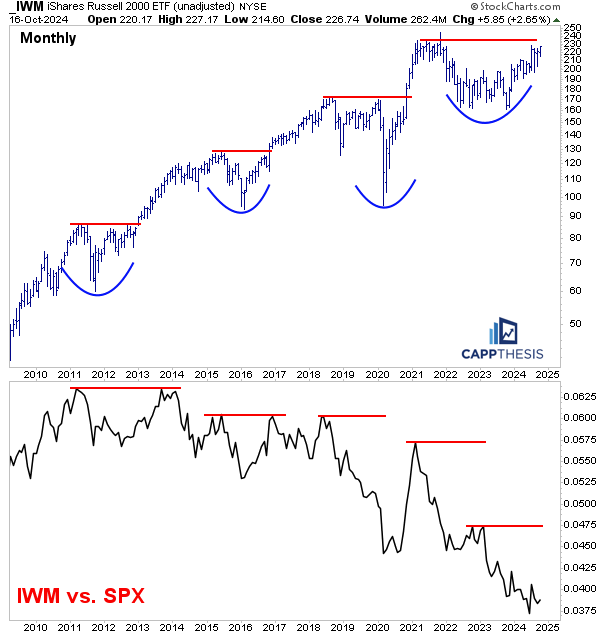
Now, let’s look at IWM relative to the S&P 500. Again, the massive move in July spurred A LOT of chatter of small caps finally starting to outperform again. Indeed, an historic burst can kick-start trend shifts. We’ve seen it before…
But, as just discussed, right now IWM and the SPX are dead even over the last year, which has done very little to alter the IWM/SPX relative ratio’s downtrend.
Even more interesting is that breakouts on an absolute basis in recent years have NOT encouraged breakouts vs. the SPX. In fact, the IWM/SPX relative line has rolled over the last three times that IWM broke out to new all-time highs.
And THIS, especially, will be extremely important to monitor as IWM potentially approaches its 2021 high point again. In other words, continuing to track both IWM and IWM/SPX will give us guidance regarding the best place to be from a market cap perspective.
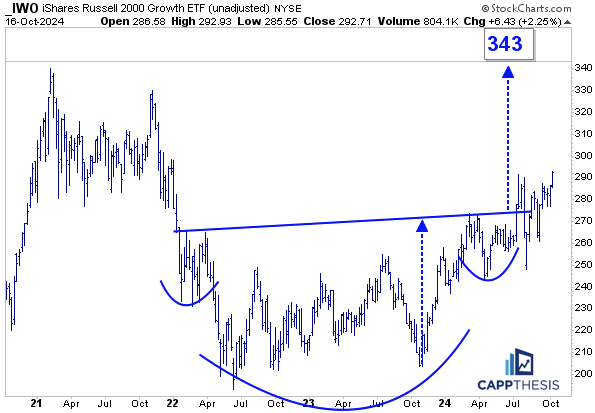
Small Cap Value & Growth
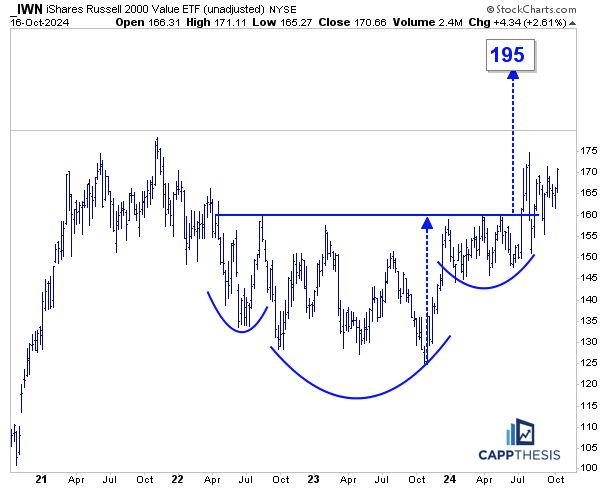
Of course, if IWM is going to work, it will need both its Value and Growth components.
IWN Small Cap Value and IWO Small Cap Growth are both in breakout modes right now. Here are the weekly charts of both.
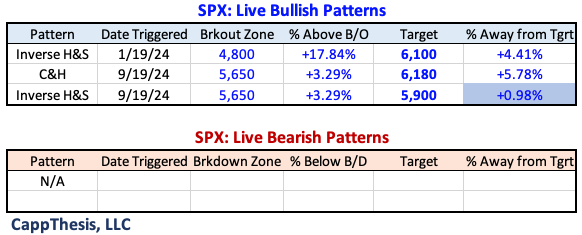
Live Patterns
The SPX finished within 1% of the 5,900-target again on Wednesday.
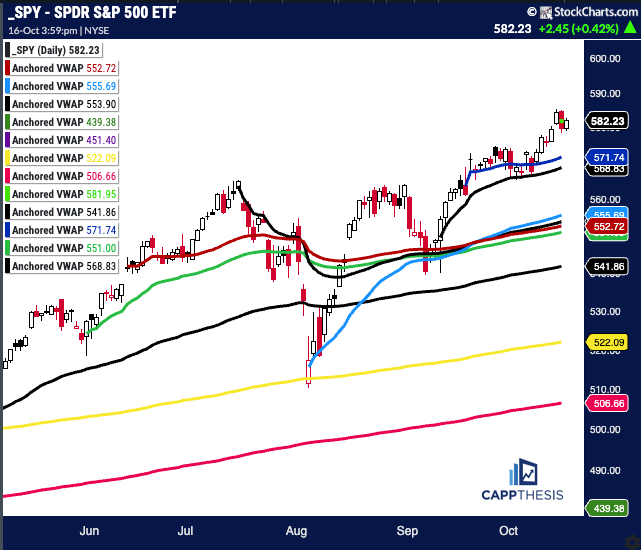
SPY AVWAP
SPY closed slightly under the VWAP line tied to 10/15 bearish engulfing pattern.
Light Green: 10/15/24 – Bearish engulfing pattern
SPY
Blue: 9/18/24 – Fed cuts rates 50 bps
Black: 9/12/25 – CPI, positive reversal
Red: 6/12/24 – CPI/FOMC
Black: 7/16/24 – July’24 high
Green: 5/31/24 – Pivot low
Black: 4/19/24 low
Light Blue: 8/5/24 – Pivot low
Yellow: 1/2/24 – YTD VWAP
Pink: 10/27/23 – October’23 low
Purple: 1/4/22 – 2022 high
Green: 10/13/22 – 2022 low
Daily Price Action
The SPX now has closed above its intra-day mid-point 6/7 days.
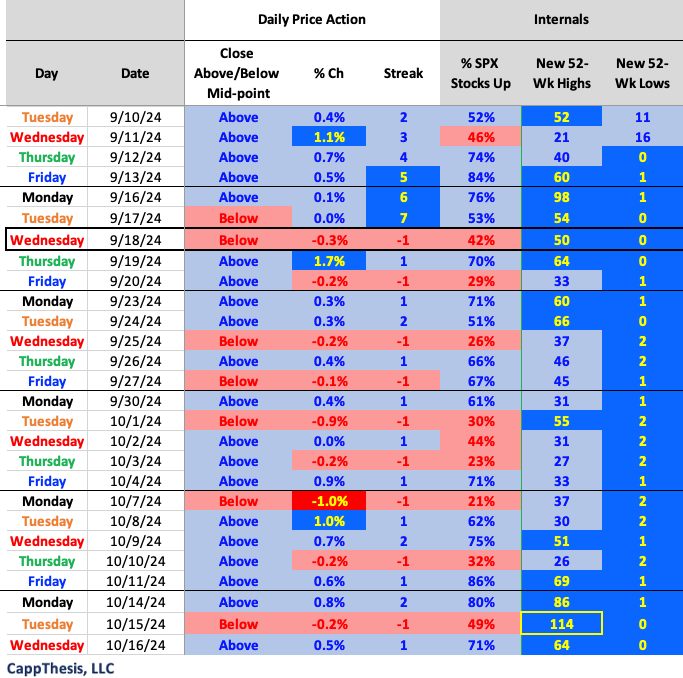
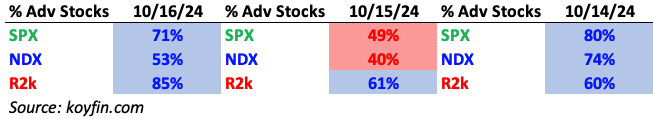
Breadth
The Russell has had positive breadth in five of the last six trading sessions.
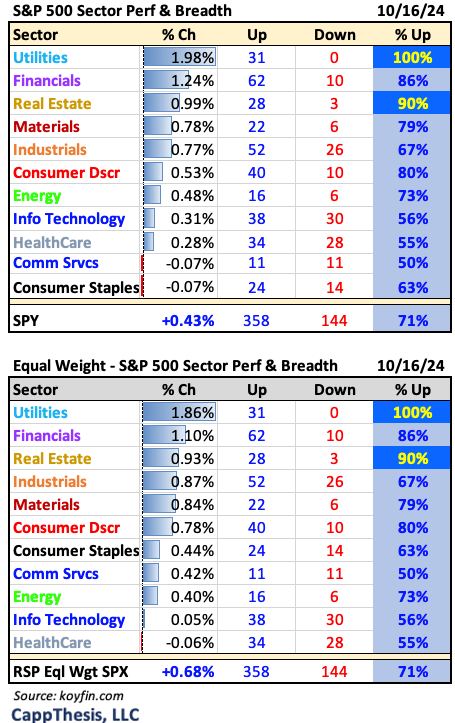
Sector ETFs
Utilities, Real Estate and Financials led yesterday, and each had very supportive breadth.
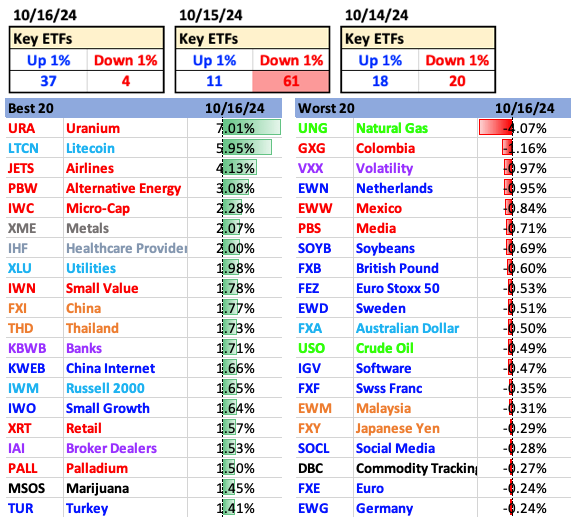
Best and Worst 20 ETFs
There were many more 1% gainers vs. decliners on Wednesday.