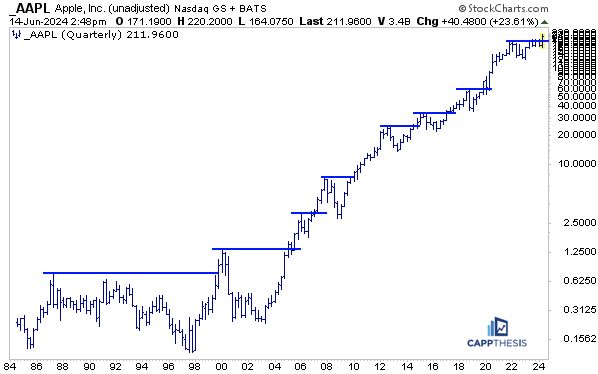
Chart of the Week – AAPL
As we know, AAPL blasted back to new highs with one of its biggest two-day gains in history this past week. In fact, the +10.3% two-day advance was the biggest since November’22 and the sixth two-day gain of at least 10% since the start of 2009.
However, exceedingly strong two-day up-moves of this magnitude or greater have happened dozens of times in its history. In fact, there were 16 such instances between 1999 and 2000 alone. So, while we haven’t seen this type of move in a while, it’s not THAT rare.
Further, let’s not forget how this move started. Back on March 7th, 2024, relative to the S&P 500, AAPL hit its most oversold state EVER. In particular, the 14-day RSI of the AAPL/SPX ratio plummeted to 12. We dedicated a whole piece to thus on 3/7/24 back then entitled “AAPL vs. SPX: Most Oversold Ever.”
This latest pop now has produced a stretched short-term condition, but on this very long-term quarterly chart, it’s just the latest multi-year breakout. Needless to say, the stock has extended higher from past big breakouts before.

Interviews, articles and social media:
CNBC Pro Article
Schwab Network Interview
The 10-Year Yield is the Most Important to the Fed
Barron’s
Tuesday
What Happens to Tesla Stock If Shareholders Reject Musk’s Pay
Wednesday
Tesla’s Shareholder Vote on Elon Musk’s Pay Looms. Stock Options Show Fear.
Thursday
After Apple’s Surge, Market Concentration Is Only Getting Worse
YouTube
CappNotes
Tuesday
https://cappthesis.com/newsletter/a-recent-trade-idea/
CappThesis Premium Content:
Starter & Professional
Monday
Opening Look: New Highs vs. Divergences
Tuesday
Opening Look: Waiting
Wednesday
Opening Look: Double Jeopardy
Thursday
Opening Look: Three Live Bullish Patterns
Friday
Opening Look: Fear of New Highs
Professional Only
Monday
Roadmap: Week of 6/10/24
Tuesday
Chart Trades: 3 buys
Friday
Breaking Out (Video)
Client meetings & calls


