Topics Covered:
-October & Q4 after -1% August and September
-Quarterly Win Streaks
-Market Maps – Month, Qtr, YTD
-Breadth Month and Qtr
–20 Best September: MSOS, URA
–20 Worst September: PBW, ARKK
–Major Indices: NDX, IWM
–Sectors: XLE, XLK
–Style: AMLP, SPHB
–Industries: OIH, JETS
–Global Mkts: TUR Turkey, THD Thailand
–Fixed Income: 10 Year Yield
–Commodities: Crude Oil
–Currencies: US Dollar
–Crypto: Bitcoin, Ethereum
-Q3 – Full Breakdown
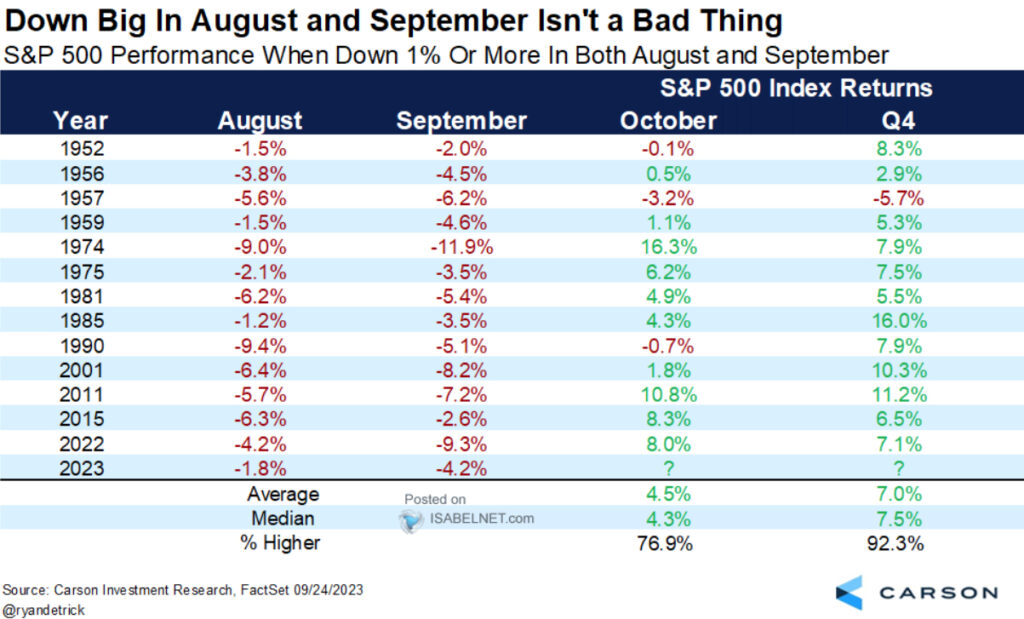
October and Q4 after -1% August and -1% September
The worst-kept secret is that the SPX has adhered to the typical sub-par seasonality path over the last two months.
However, monthly declines greater than 1% for both August & September (like just happened) have been rare over the years. In fact, since 1950, it’s only happened 13 prior times before 2023.
And as Ryan Detrick of Carson Group shows us below, the SPX has been higher 77% of the time in October and 92% for Q4 after losses of at least 1% for both months. The average moves have been +4.5% and +7%, respectively.
In the four occasions since 2000, the SPX has been higher 4/4 times both in October and in the fourth quarter…
Thus, the statistics and seasonality are bullish…
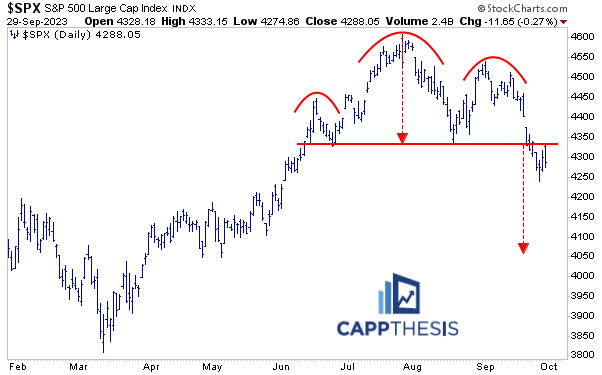
…but with the SPX ending September below the big bearish pattern, getting back above the breakdown zone is chore number one for October.
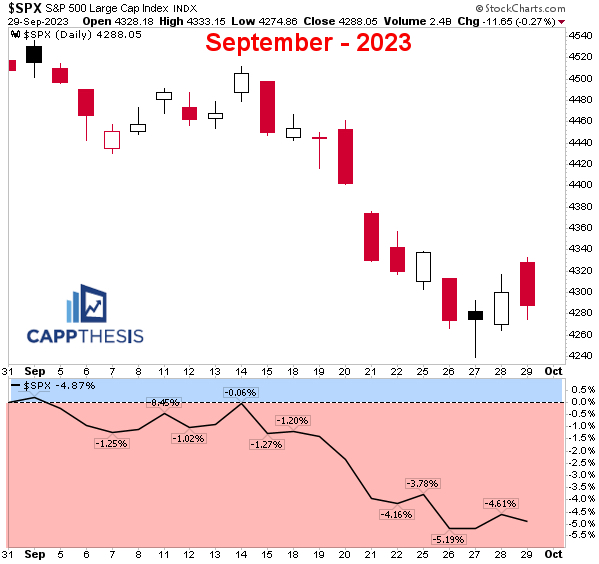
Monthly Track
September was dominated by more losses than gains, bigger losses than gains and more closes on the lows vs. on the highs. Major trend shifts begin in the short-term first, thus, all the above will need to improve before the longer-term bid can return.
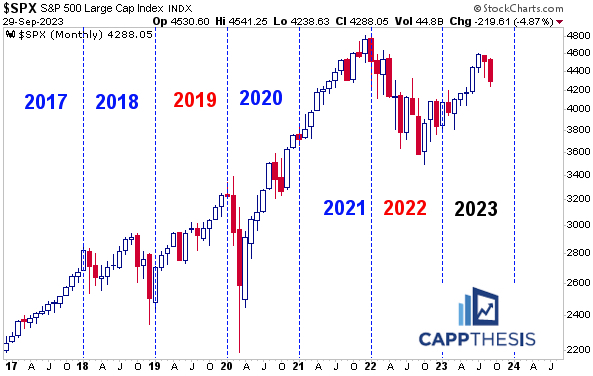
Monthly SPX Chart
The SPX now is down two straight months, which is the first two-month losing streak since September – October’22. The last three-month losing streak happened from January – March’20.
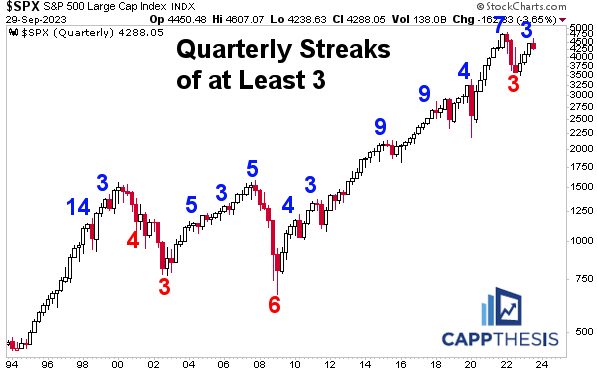
Quarterly Streaks
September’s big decline prompted a down quarter for the first time since Q3 of last year, ending the three-quarter win streak.
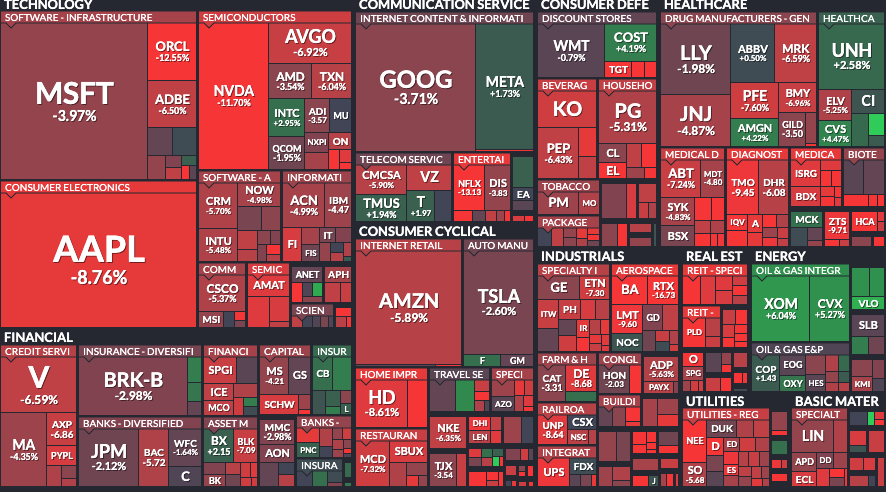
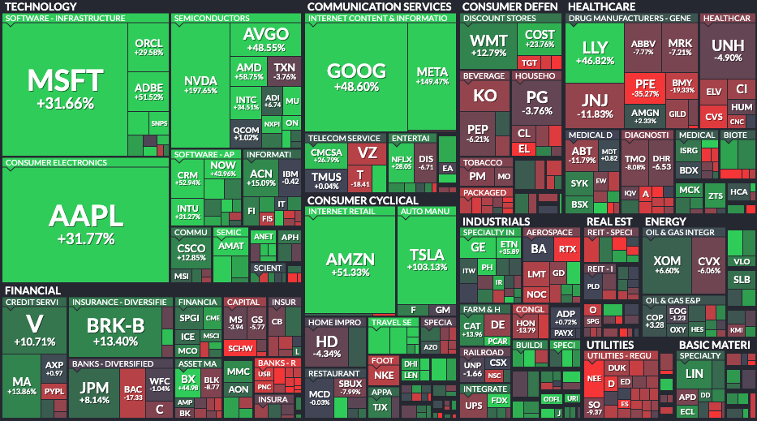
September Market Map
It was a sea of red among the SPX’s components, except for select Energy (and a few other) names in September. Notably, AAPL was down for both the month and quarter.
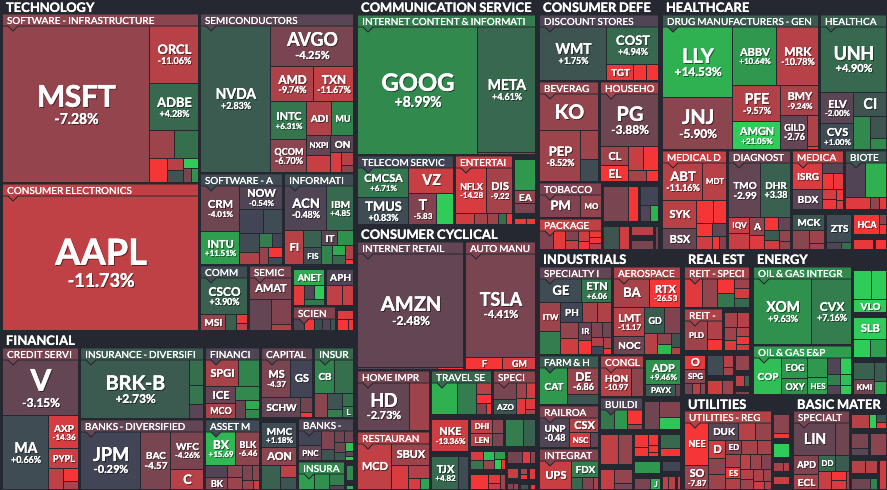
Below are market maps for the month, quarter and YTD – with more green boxes the further we zoom out, especially for mega-cap growth stocks.
Q3 Market Map
YTD Market Map
Breadth – September
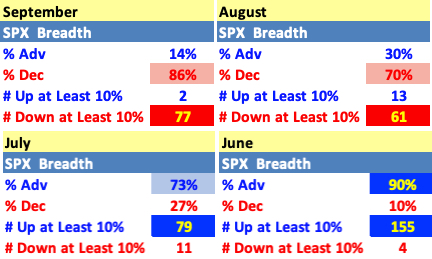
Breadth has been worsening each month since the +90% reading in June. In fact, with 86% S&P 500 stocks lower this past month, it was the worst monthly breadth since September’22 at -95%.
Breadth – 3Q
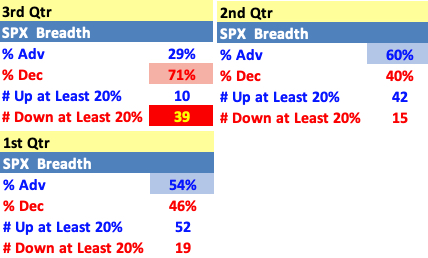
At -71% for Q3, it was easily the worst quarter of 2023, as well.
Performance Stats & Charts
Full performance stats for both September & August and monthly charts for some of the best and worst ETFs within each section appear below.
Best 20 ETFs
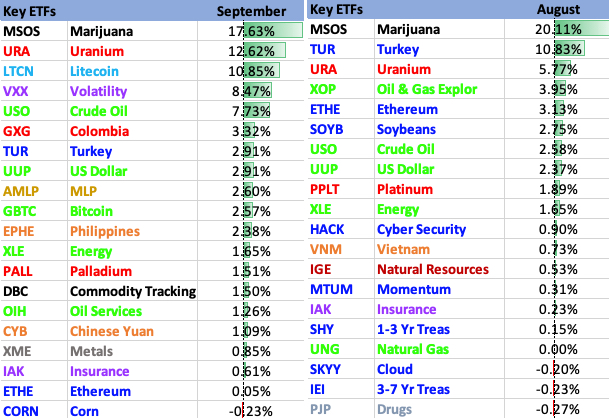
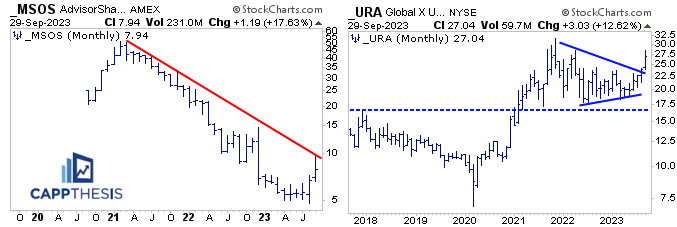
MSOS Cannabis took top honors for the second straight month. Given the carnage it has endured the last 2 ½ years, the ETF remains below a long-term downtrend line.
Uranium also was among the monthly leaders the last two months, with it extending the August breakout in September. New highs remain in the crosshairs.
Worst 20 ETFs
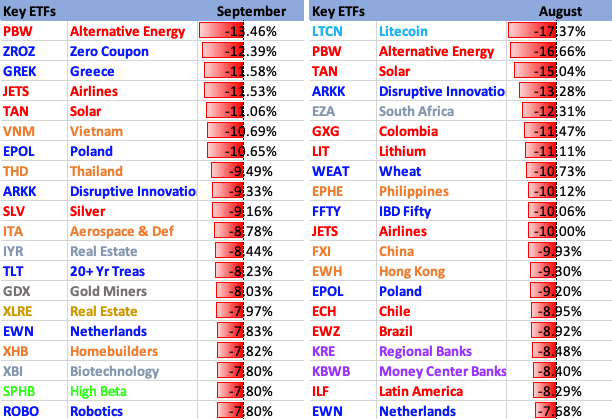
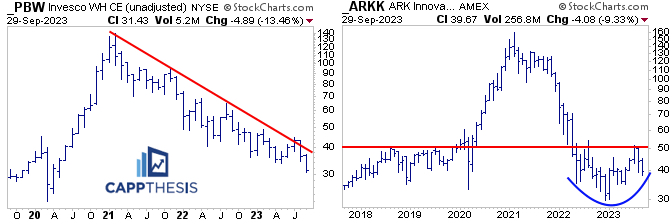
PBW Clean Energy now is down 28% over the last two months, its third-worst 2-month decline since the Great Financial Crisis. It tested its own major downtrend line in July, which clearly failed to encourage upside follow through. Selling long-term strength continues.
ARKK also has been hammered the last two months, most notably failing near the key 50-zone. This also was key resistance from 2018-2020 before the big run up. ARRK still has a chance to log a higher low and keep its long-term basing potential alive.
Major Indices

For the market to rally in October in and Q4, it clearly needs Large Cap Growth to be part of it. The NDX is sitting right on a steep uptrend line, as it will try to leverage the last two sideways months for another up leg.
IWM R2k underperformed for two straight months and continues to flirt with a VERY IMPORTANT support zone between 160-70.

S&P 500 Sectors
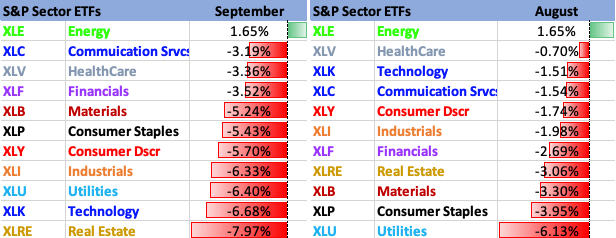
XLE Energy was the only sector ETF up in both August and September – ironically gaining 1.65% two straight times. It has maintained its uptrend and is close to a multi-year breakout.
XLK Technology was the second worst sector ETF in September, which obviously prevented it from breaking out to new all-time highs. It remains close to said highs, as it will be trying to stay above the YTD uptrend line in October.

Style
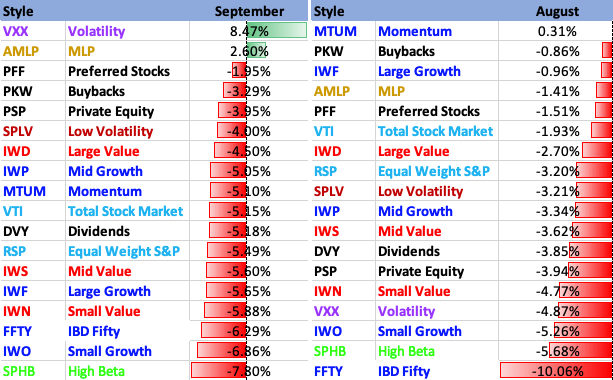
Other than the VIX ETF, AMLP was the only Style ETF we track up last month. It’s been testing a major resistance (former support) line for nearly two years. Getting through the low 40s, thus, would be a major breakout.
SPHB High Beta was near the bottom of the performance ledger for two straight months, as its biggest sectors got hit hard – Tech and Consumer Discretionary. Like many others, it’s now important for the ETF to respect the pictured long-term uptrend line.

Industries
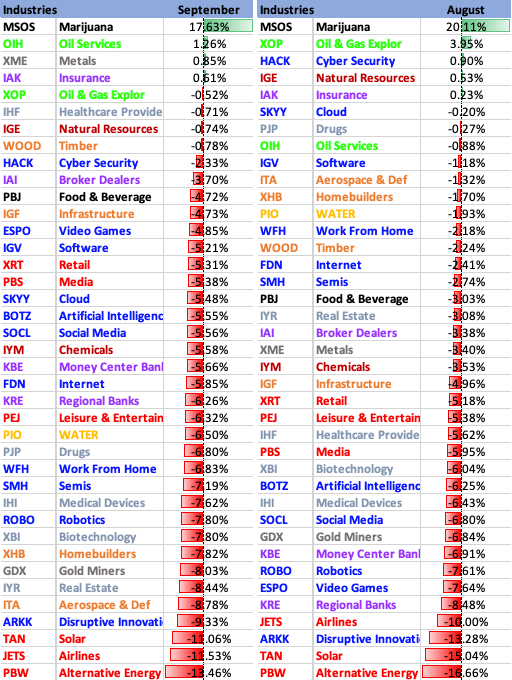
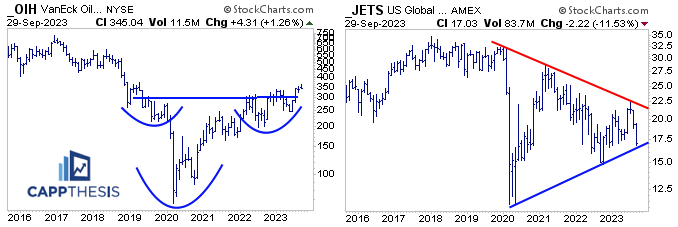
OIH Oil Services squeaked out a monthly gain in September and maintained its large base breakout.
JETS lost over 10% for the second straight month and fell right back to its own multi-year uptrend line. The massive triangle pattern, thus, still is in play. As noted recently, it’s oversold from a daily perspective, thus, the ETF will be looking to bounce near the line again.
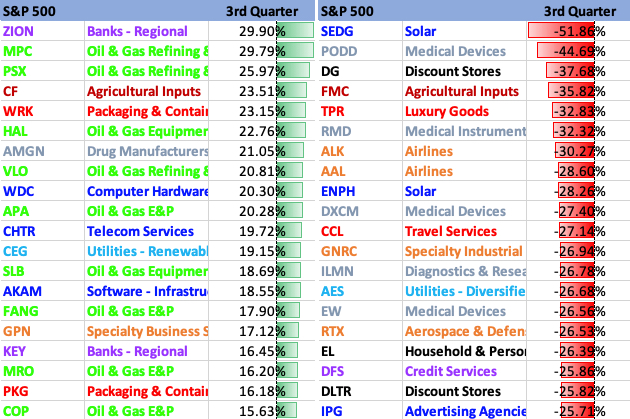
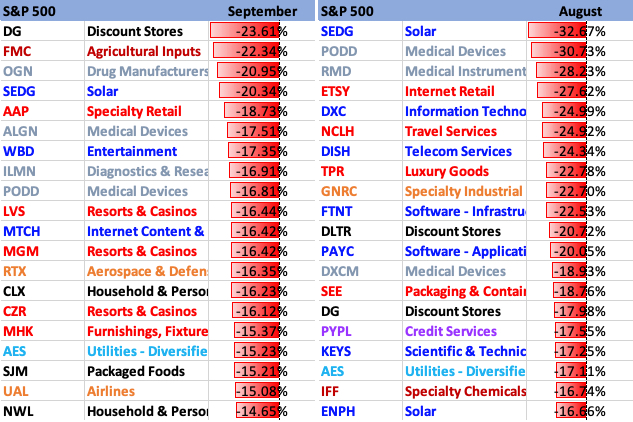
S&P 500 – Best 20
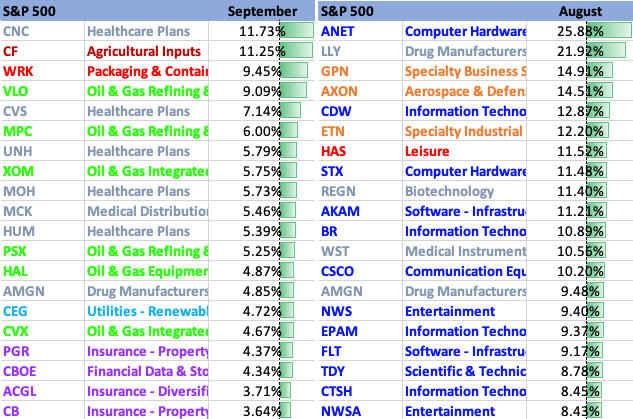
S&P 500 – Worst 20
Global Markets
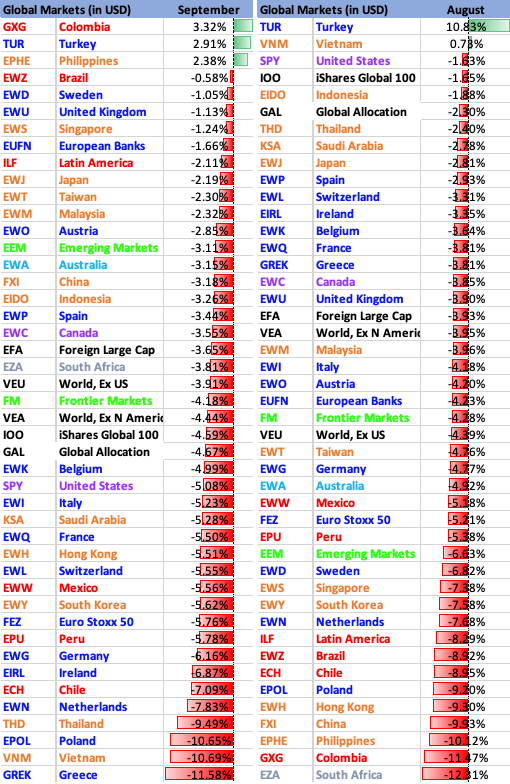
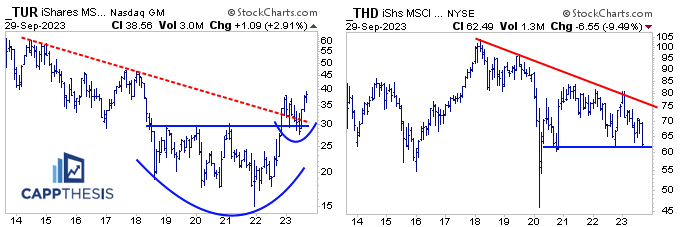
TUR Turkey has continued to fight back from a tough start to 2023 and logged its highest monthly close since 2018. Its multi-year breakout remains in play and it’s still above the very long-term downtrend, too. It is volatile day-to-day, but the long-term pattern is constructive.
THD Thailand fell back to critical support in September. And given the huge air-pocket just below current levels, it’s important to see a bid return again here.
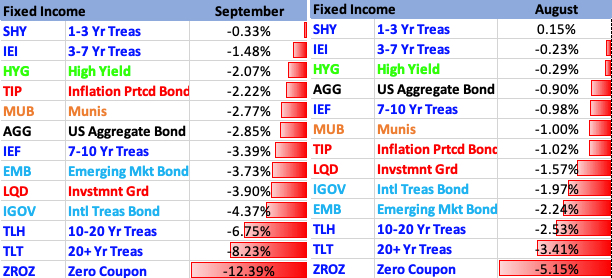
Fixed Income
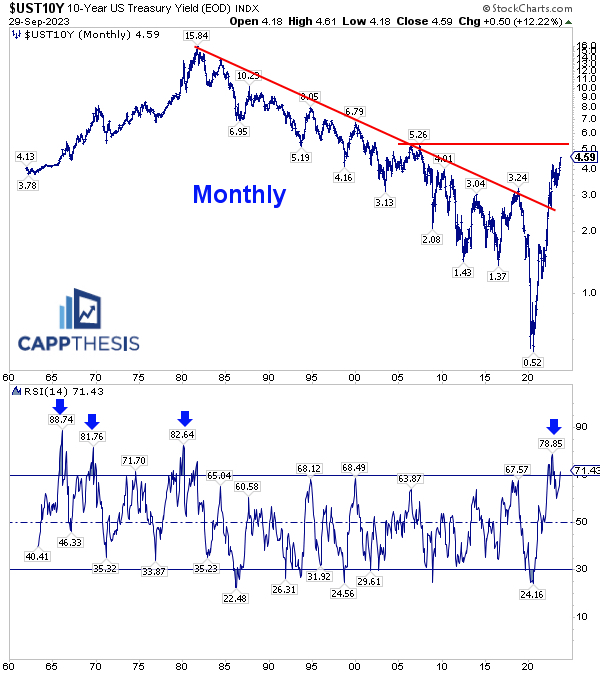
The 10-Year Yield’s strong move last month pulled is 14-month RSI indicator back to overbought territory. That’s important to recognize since the indicator routinely returned to overbought conditions through its ascent from the 1960s-early 1980s.
The yield was last overbought in 1982, showing how this time is, indeed, different than anything we’ve seen in the last four decades. The next key level is near 5.25%, as noted below.
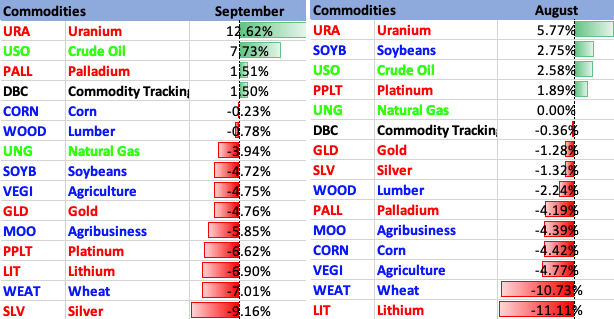
Commodities
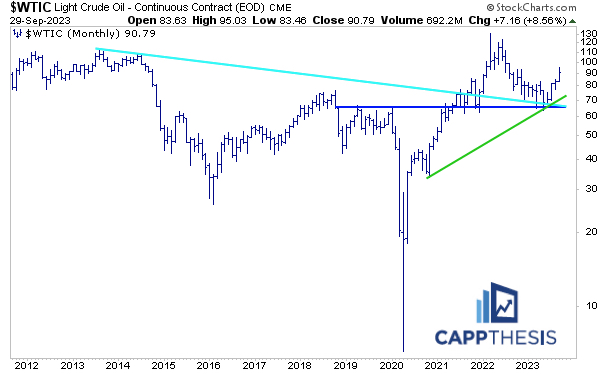
This long-term chart of Crude Oil shows how significant it was to hold in the mid-60s over the summer – three different trendlines all converged around the same area. Therefore, Crude Oil remains in an uptrend since the 2020 lows AND has yet to truly take advantage of a near-decade long base.
Currencies
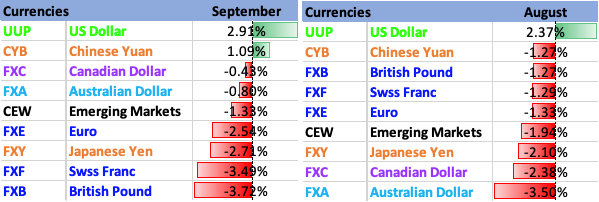
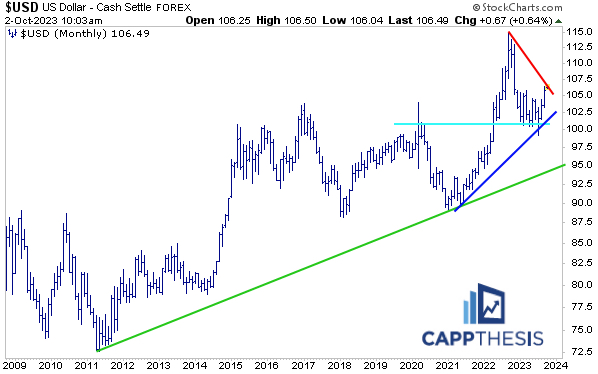
The US Dollar’s strength has been well-documented, as the bounce from the blue uptrend line in July helped produce the strong extension the last two months. It’s now testing the downtrend line from the 2022 peak… which all has taken place above a much longer trendline from the 2011 lows.
Crypto

Both Bitcoin and Ethereum continue to hug their respective multi-year uptrend lines.

3rd Quarter Full Breakdown
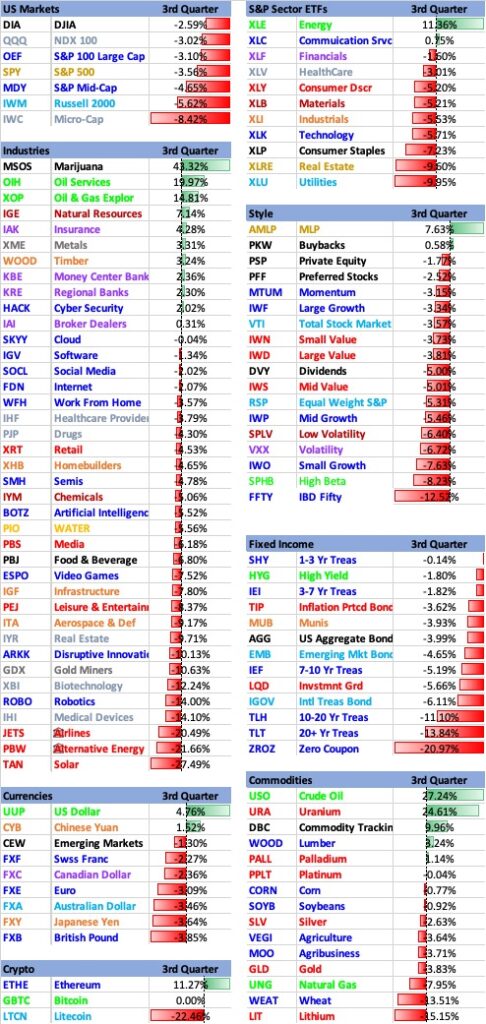

Q3 Best & Worst ETFs
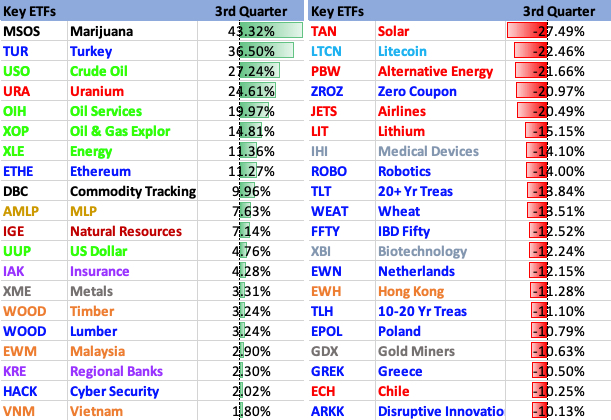
Q3 Best & Worst S&P 500 Stocks
