Key Points:
1- The SPX comes into September’s second half fresh off its first 1% loss since August 24th. The question is whether Friday’s downturn now kick starts a greater occurrence of large daily moves from here.
2- The average 20-year September path has shown buy interest through mid-month before fading and finishing lower. While the recent bounce wasn’t forceful, this same track played out again.
3- Friday’s rollover produced a slightly lower high vs. September 1st, and now we’ll be watching a new potential bearish pattern develop.
Topics Covered:
-One percent moves
-Seasonality
-Pattern update
-AVWAP
+/-1% Moves
The SPX comes into September’s second half fresh off its first 1% loss since August 24th, which, we’ll recall was a huge outside negative day. But with zero downside follow through back then, it was reversed immediately. The strong bounce to conclude the month then quickly ensued…
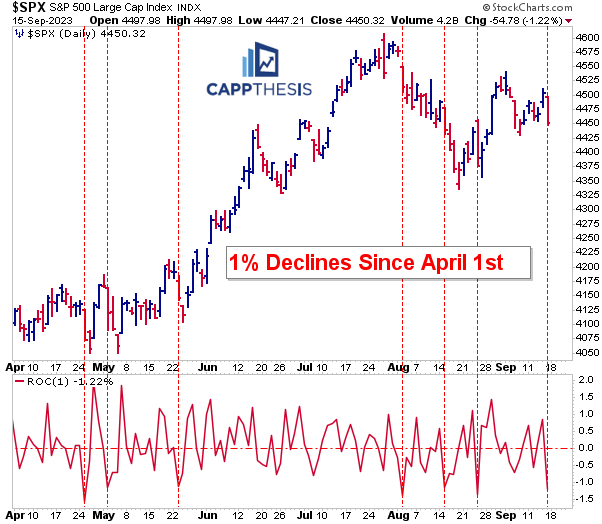
As we’ve talked about many times, the number of 1% moves (especially 1% declines) dramatically decreased as the second quarter started.
This is important to monitor because the low frequency of 1% gains and losses have equated to lower volatility and up-trending price action. That was put to the test last month, and the SPX responded.
Here’s an updated table.
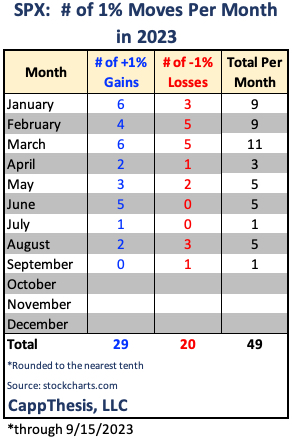
Of the twenty 1% losses in 2023 so far, just seven have occurred since April 1st – over nearly six months of trading. Three of those happened in August, which was the most since March.
The question, of course, is whether Friday’s downturn now kick starts a greater occurrence of large daily moves from here.
Seasonality
The SPX now is -1.3% for the month after Friday’s -1.2% decline. As we know, its September track record is among the worst of any month for the year. But it’s typically not straight down from start to finish.
The average 20-year path has shown buy interest through mid-month before fading and finishing lower.
While the recent bounce wasn’t forceful, this same track played out again. The key difference so far this time is that the SPX did not make a new high in the process. Indeed, that wasn’t expected as we entered the month given how far below the July high the index started September.
Regardless, we see how important it is to hold above the summer lows from a seasonality perspective: doing so could help provide a launching pad, which the SPX has taken advantage in Q4 various times before in recent years.

Patterns
Last Friday’s persistent decline pretty much killed off the good vibes from Thursday’s solid – yet seemingly unconvincing – advance.
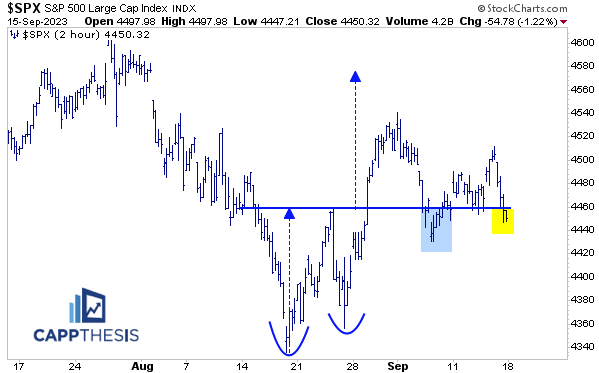
It’s not pretty, but we’ll keep the bullish formation on our pattern grid until there’s a more forceful close below the breakout zone around 4,455.

Updating the other SPX charts, the index closed right on the lower threshold of the triangle pattern.
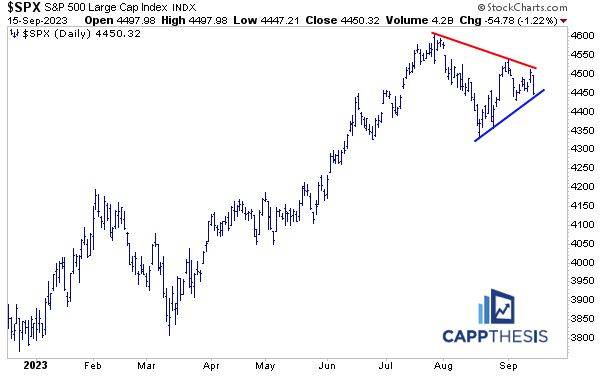
With higher lows still in place, the bigger, potential cup/handle formation remains viable. Clearly, a continued sell off from here would hurt its chances of playing out.
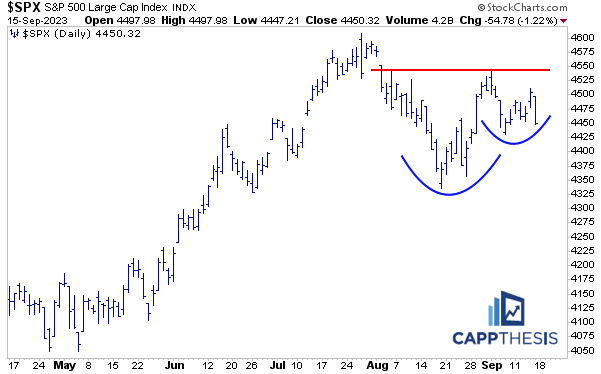
A New Bearish Pattern to Watch
The rollover produced a slightly lower high vs. September 1st, and now we’ll be watching this potential bearish pattern develop.
Breaking below the support line near 4,430 would put the August lows in the crosshairs and simultaneously negate the current live bullish pattern and put stress on the potential bullish c/h pattern above.

Trading Range
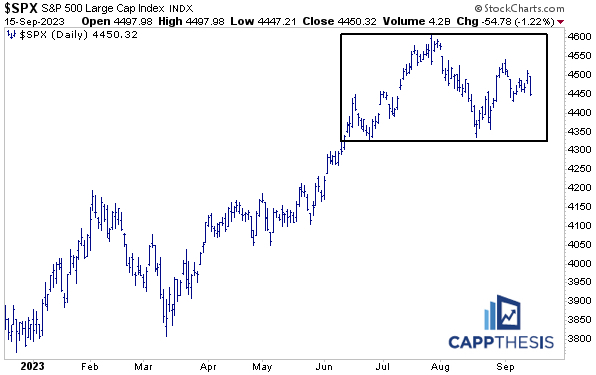
Bigger picture, the index remains inside the large trading range. From this perspective, the SPX has made no net ground since the official start of summer – with just a few days left before fall begins.
Being able to consolidate after a sizable preceding run up is a key characteristic to any uptrend. Thus, seeing this continue while staying above the key lows from August and June is critical now.
This is especially true as the index enters the second half of September…
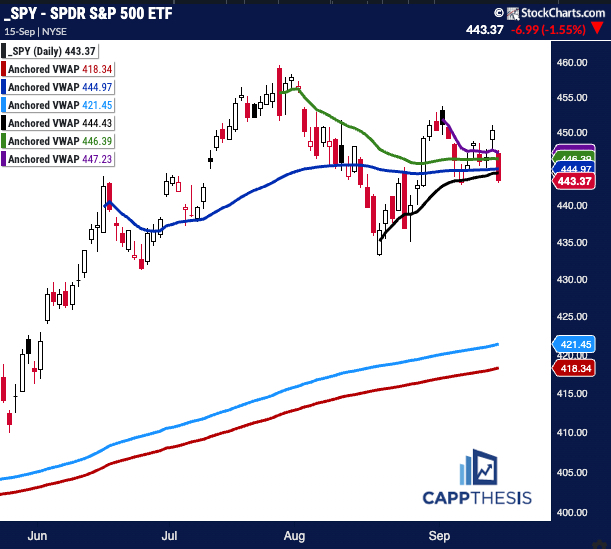
SPY AVWAP
Last Friday’s action made a mess of the Anchored VWAPs, with the SPX now below each of the recent lines. Thus, reclaiming each quickly now will be the next challenge.
