Topics Reviewed:
– SPX Performance
– Patterns
– Breadth
– Sector Perf & Breadth
– Best & Worst 20 ETFs
– New Highs/Lows
– XLP, XLU, XLV
– US Dollar
– XHB Homebuilders
– XLE Energy
Performance
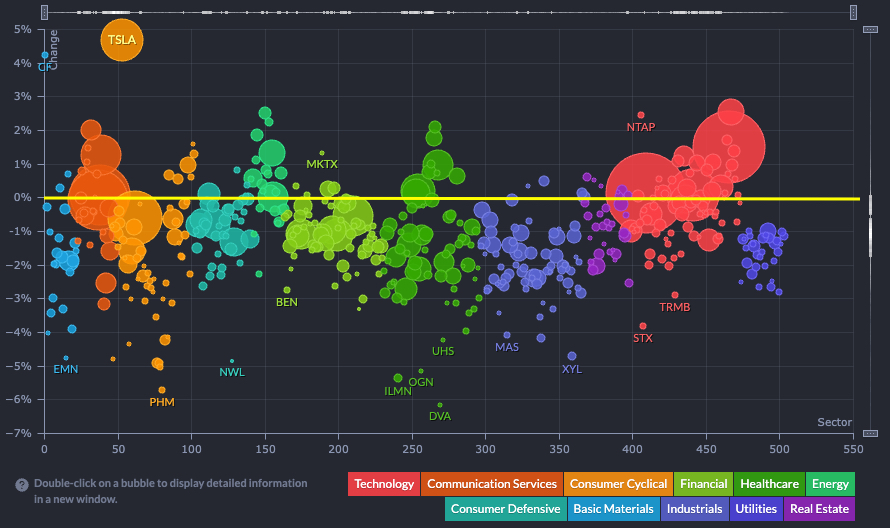
The SPX started the four-day week with a 42-bps decline, which was helped in a major way by outperformance by some of its biggest and most influential growth names. This is best captured by this bubble map from finviz.com. Not surprisingly, many of the biggest names were above (or close to) breakeven.
More below in the Sector ETF section…
Patterns
The SPX’s small bullish pattern breakout remains in play, as the index now is about 90 bps above the 4,455-breakout zone.

Breadth
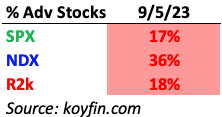
Breadth was negative and finished at the lows. The SPX was the worst at just 17%.
Sector ETFs
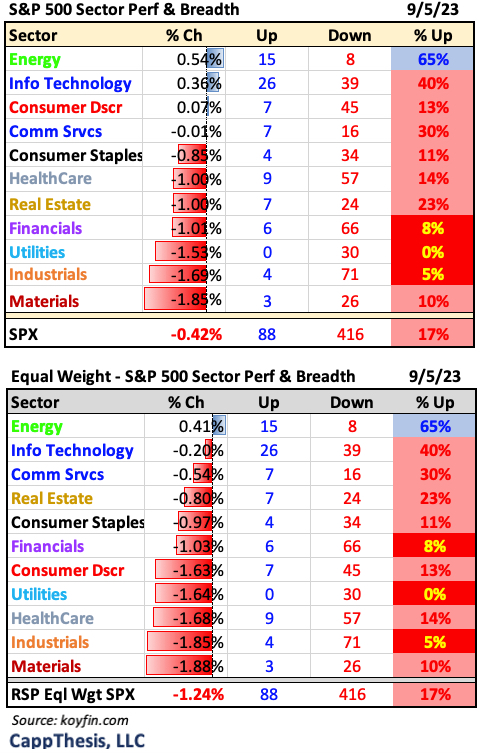
We see how bad it was under the surface by the performance difference in the RSP Equal ETF, which was -1.24%. Financials, Utilities, and Industrials had more than 90% of their components finish lower.
Only Energy squeaked out positive internals, but as late as 1:00 PM, 22/23 of its holdings were higher.
Best and Worst 20 ETFs
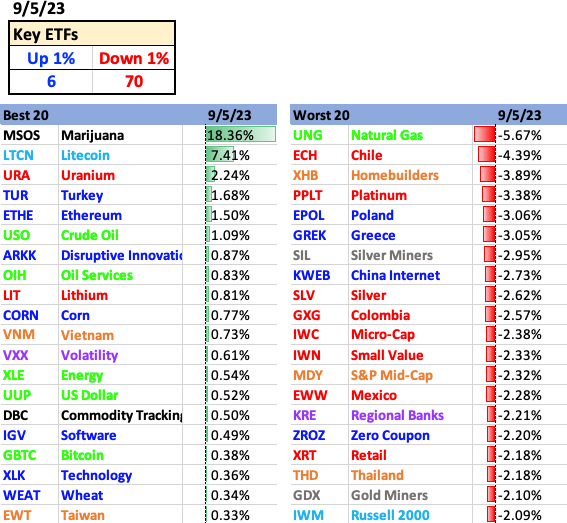
The carnage was clear in our ETF list, with the number of 1% decliners outpacing the 1% advancers 70-6. ARKK was the best Growth ETF at +87 bps.
ETFs – New Highs & Lows
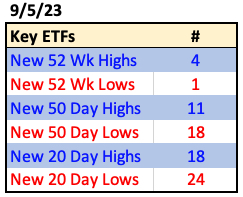
24 ETFs we track made new 20-day lows today. That’s not a lot, but many others now are close after today, thus, additional weakness could force this number to expand quickly.
XLP, XLU, XLV
Three of the above mentioned 24 were sector ETFs: XLP, XLV and XLU. XLP and XLU noticeably breached support zones; XLV closed right back near its own critical support area near 132, which makes holding here very important.

UUP US Dollar
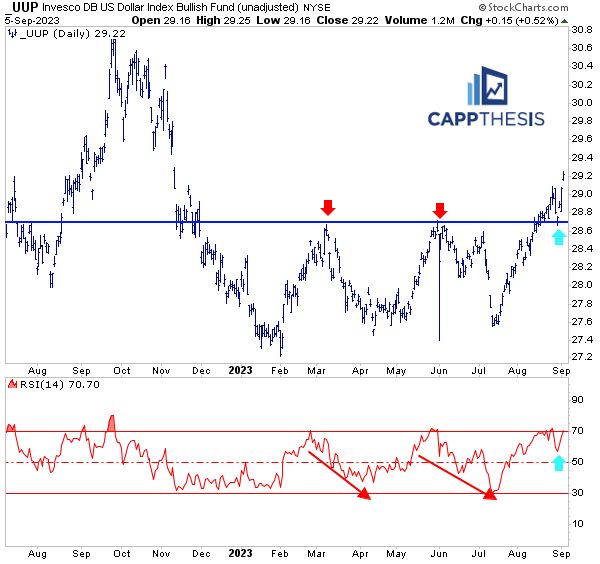
The Dollar logged its biggest gain since 7/27, which comes after its SEVENTH straight up week. Of note is how buoyant its 14-Day RSI has been, especially as it has battled the same supply zone that halted the prior advances.
UUP’s RSI has been above 50 since July 27, as well, the day the SPX topped. Needless to say, this isn’t the best backdrop for equities should it continue.
XHB Homebuilders
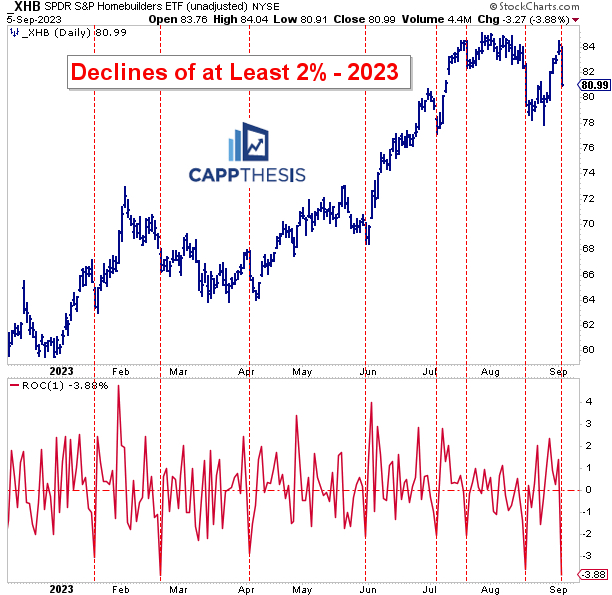
XHB logged its biggest decline today since 2/21 – losing 3.9%. This has happened after the ETF dropped over 3% on 8/18, as well. While that didn’t mark a key low, XHB did not go much lower than that in the days the followed. It then spiked with the market recently. This decline could change things…
XHB now has endured eight losses of at least 2% in 2023. A bid emerged within days after each of the prior seven. As we often say, if that does NOT happen this time, we’ll know things have changed.
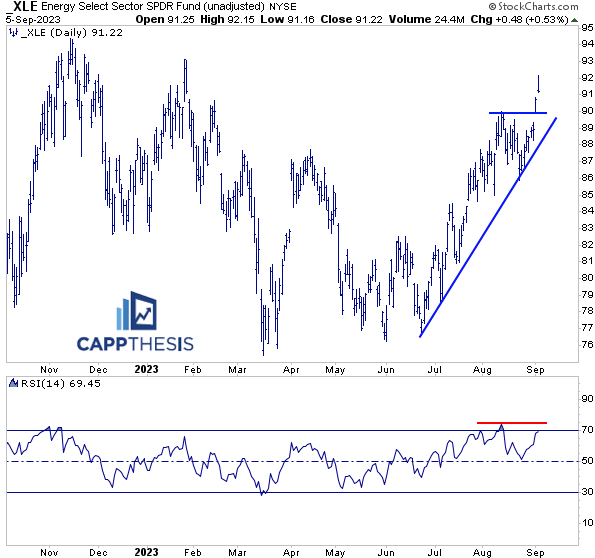
XLE Energy
XLE finished on its lows, but it held on for its seventh straight advance. The recent spike has yet to trigger an overbought condition, though. Thus, this negative divergence may finally lead to some short-term weakness. Seeing how it deals with the steep uptrend line will be telling.
