Key Points:
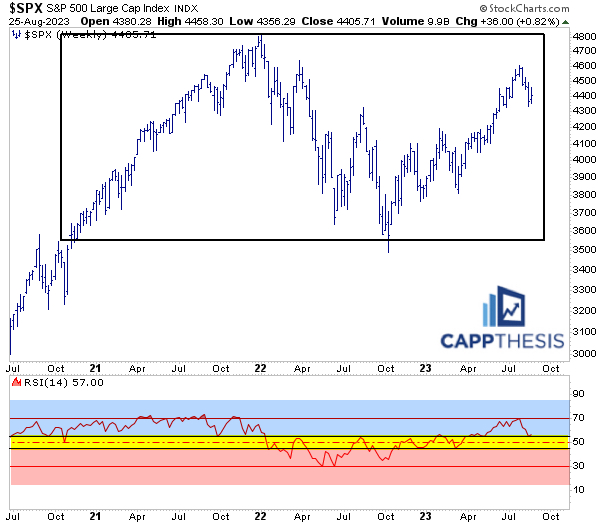
1- Longer-term, the SPX’s 14-week RSI stayed in the upper range during the upswing through 2021 and below the range in 2022… and back above it in 2023. The weekly RSI finished at 57 last week, which still is supportive of the current uptrend right now.
2- Two key characteristics in August have been a lack of good closes and limited follow through. A simple tell is that we haven’t seen back-to-back gains since July concluded.
3– SPY finished back above the VWAP anchored to the 8/18 low point for the third time in the last five days. It needs follow through here, as well.
Topics Covered:
-Intra-day closes
-Testing l/t breakout zones
-Bearish pattern update
-Trading boxes
-The big range w/ 14-wk RSI
-50-day MA of 14-day RSI
-SPY AVWAP
SPX:
Four trading days are left in August, and the month has lived up to its recent sub-par history. The question is whether the four-week downtrend will develop into something more substantial (harmful) beyond the -6% decline for the SPX.
Again, as July concluded, the index just achieved its fourth straight upside target, and there was no indication of another bullish formation.
The SPX also was hovering near overbought territory, thus, we had little to lean on from that angle, either. Indeed, uptrends have to be respected, but they are never straight up. Even the most persistent upswings are created by short-term consolidation periods being resolved higher.
Digestion is healthy… until something changes.
In August, the dip-buying that dominated the landscape from the March lows simply hasn’t been apparent. Two key characteristics have been a lack of good closes and limited follow through. A simple tell is that we haven’t seen back-to-back gains since July concluded.
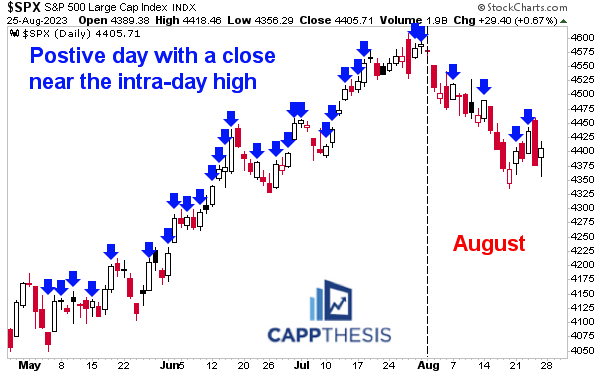
The more that continues to happen, the less encouraged buyers will be to 1. buy dips and 2. hold onto fresh buys if they don’t work out right away.
As detailed in yesterday’s PostScript report, many ETFs and stocks have dropped back to key breakout zones. So, if the dip is indeed going to be buyable this time, then a bigger bounce effort would have to occur soon.
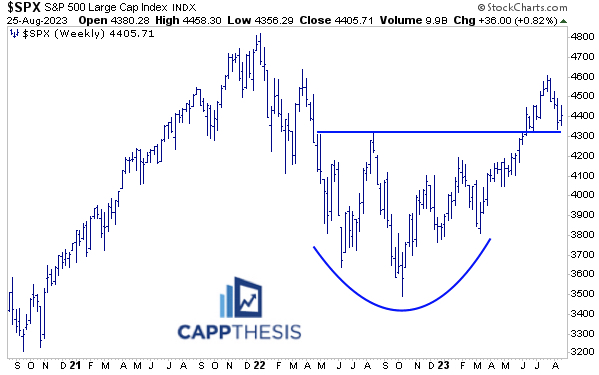
If the next rally attempt again is wasted (like last week), then the bigger bearish patterns out there like this would be at risk…
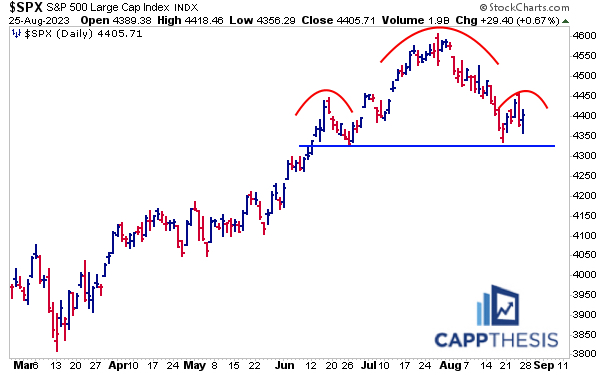
… as of now, there currently are no live patterns in the SPX:

Trading Boxes
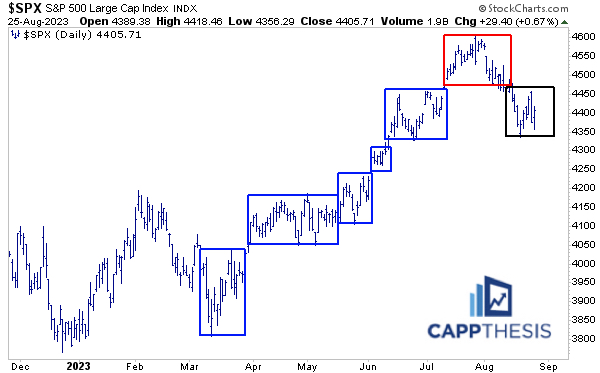
The advance from March also can be viewed through these trading range boxes, which we discussed on the way up. The July – early August action produced a similar-looking pattern as the prior five, with the obvious difference being that it was broken to the downside.
The price action over the last two weeks has created the latest iteration. The parameters are clear. Another downside break could prompt another lower trading range. That would coincide with the above bearish pattern being completed, as well.
The Big Range w/ 14-wk RSI
Zooming way out, we can classify the action over last three years as one big range, using the October breakout in 2020 as the starting point. Notice how the 14-week RSI stayed in the upper range during the upswing through 2021 and below the range in 2022… and back above it in 2023.
The weekly RSI finished at 57 last week, which still is supportive of the current uptrend.
50-Day MA of the 14-Day RSI
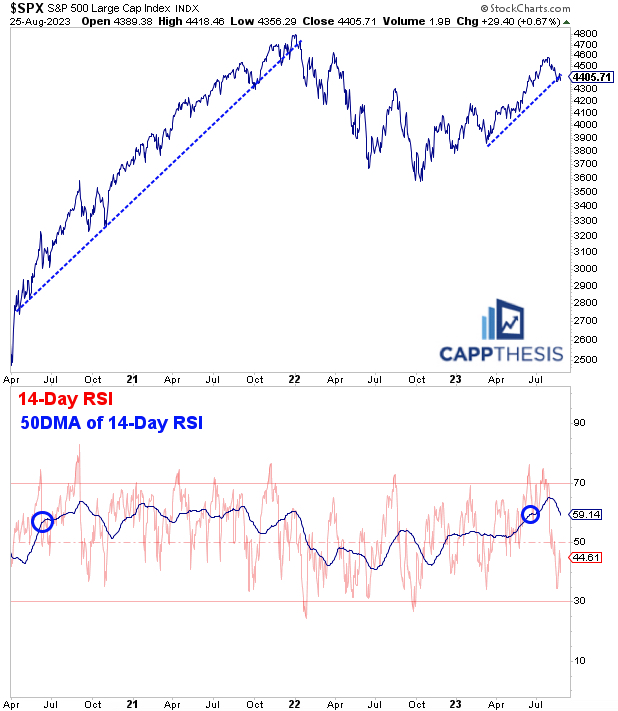
Here’s another way to track longer-term momentum, which we first discussed early in the summer.
In 2020, the strong pop from the low turned into a more consistent uptrend in June. At the time, the 50-day moving average of the 14-day RSI first overtook the 60 level. And we see how long the uptrend lasted from that point. It didn’t end until the smoothed indicator line undercut 50 in early January’22.
The same line crossed 60 again in June’23. Thus, tracking to see where it bottoms now will be instructive: if said bottom is above 50, it would confirm that the uptrend remains in play.
SPY AVWAP
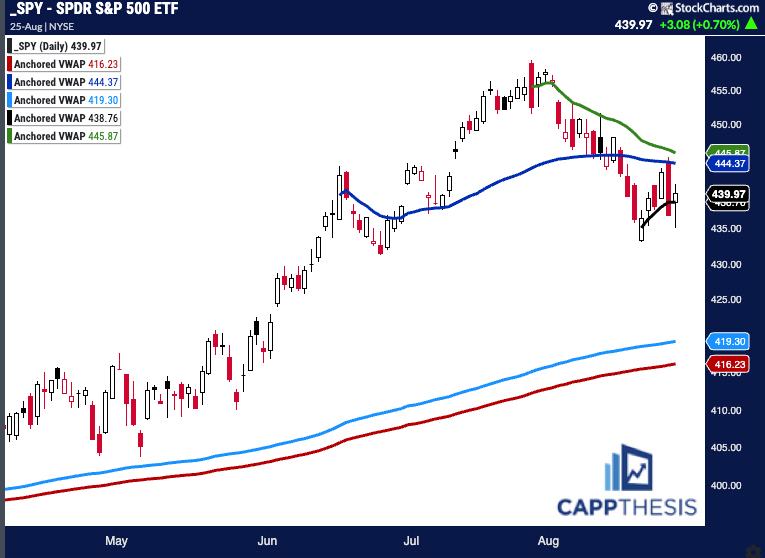
SPY finished back above the VWAP anchored to the 8/18 low point for the third time in the last five days. It’s respected support in this sense. It needs follow through here, as well.
